Making informed solar investment decisions requires rigorous financial analysis backed by comprehensive data and proven methodologies. Modern solar power financial models now enable stakeholders to evaluate projects with unprecedented precision, factoring in variables from equipment costs and energy production estimates to complex incentive structures and future electricity rates.
This analytical approach has become essential as solar technology matures into a mainstream investment vehicle, with internal rates of return frequently exceeding 10% when properly structured. By examining key metrics like levelized cost of energy (LCOE), net present value (NPV), and payback periods, investors can make data-driven decisions that optimize both environmental impact and financial performance.
The convergence of declining installation costs, improving panel efficiency, and sophisticated financial instruments has transformed solar from an alternative energy option into a compelling investment opportunity. Understanding these dynamics through careful financial analysis not only mitigates risk but also unlocks maximum value from renewable energy assets.
This comprehensive guide explores the critical components of solar financial analysis, equipping you with the tools to evaluate projects effectively and make informed investment decisions in the rapidly evolving renewable energy landscape.
Key Financial Metrics for Solar PV Analysis
Initial Investment Costs
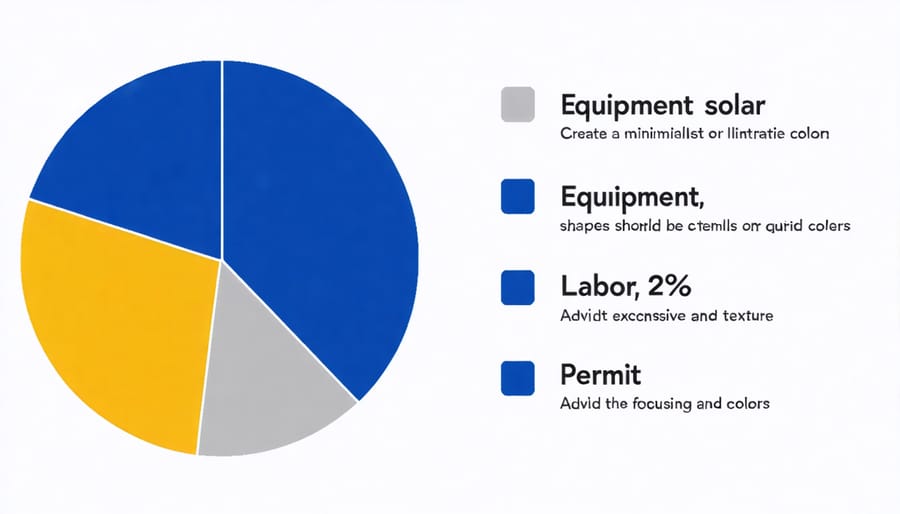
The initial investment in a solar panel system comprises several key cost components that must be carefully evaluated. Equipment costs typically account for 50-60% of the total investment, including photovoltaic modules, inverters, mounting hardware, and monitoring systems. High-efficiency panels generally command premium prices, ranging from $0.70 to $1.50 per watt, while inverters contribute approximately $0.30 to $0.50 per watt to the total cost.
Installation labor represents 20-30% of the investment, varying significantly based on system complexity, roof configuration, and local labor rates. Professional installation ensures optimal system performance and compliance with safety standards, typically costing between $0.50 and $1.00 per watt.
Permitting and interconnection fees constitute 10-15% of upfront costs, encompassing building permits, electrical inspections, and utility connection charges. These administrative expenses vary by jurisdiction, typically ranging from $400 to $2,000. Additional costs may include structural engineering assessments, electrical system upgrades, and monitoring equipment installation.
The total initial investment for a residential solar system typically ranges from $15,000 to $25,000 for a 6kW system, before applying any available tax incentives or rebates.
Levelized Cost of Energy (LCOE)
The Levelized Cost of Energy (LCOE) serves as a crucial metric in solar financial analysis, enabling investors and stakeholders to compare different energy generation technologies on an equal basis. This calculation measures the present value of the total cost of building and operating a power-generating asset over its lifetime, divided by the total energy output of the asset over that lifetime.
LCOE incorporates several key components: initial capital costs, fuel costs, operations and maintenance expenses, financing costs, and the system’s expected energy production. For solar installations, the formula typically excludes fuel costs but must account for panel degradation over time, which affects long-term energy production.
The metric is expressed in dollars per kilowatt-hour ($/kWh) and provides a standardized way to evaluate the economic viability of various energy alternatives. When analyzing solar projects, a lower LCOE indicates better cost-effectiveness compared to other energy sources. This makes it particularly valuable for demonstrating solar energy’s competitiveness against traditional power sources.
Understanding LCOE helps decision-makers identify the most cost-effective energy solutions while accounting for differences in project scale, technology, and geographic location. However, it’s important to note that LCOE should be considered alongside other financial metrics for a comprehensive investment analysis.

Payback Period Analysis
Payback period analysis serves as a fundamental metric in solar investment evaluation, offering both simple and discounted calculation methods to determine when your initial investment will be recovered. The simple payback period divides the total system cost by annual savings, providing a straightforward timeline for investment recovery. However, this basic calculation doesn’t account for time value of money or changing electricity rates.
For more precise analysis, the discounted payback period incorporates these financial factors, offering real ROI data that reflects market conditions. This method uses a discount rate to adjust future cash flows to present value, typically ranging from 5% to 8% for residential installations.
To calculate discounted payback:
1. Determine initial investment costs
2. Project annual energy savings
3. Apply appropriate discount rate
4. Account for maintenance costs
5. Factor in degradation rates
Modern solar installations typically achieve payback periods between 5-10 years, depending on location, energy costs, and available incentives. Understanding these calculations enables investors to make informed decisions while considering the long-term financial benefits of solar energy systems.
Financial Incentives and Support Mechanisms
Tax Credits and Rebates
Tax incentives and rebates significantly enhance the financial viability of solar PV installations, making them an essential component of modern PV financing options. The federal Investment Tax Credit (ITC) remains one of the most substantial incentives, offering a 30% tax credit on the total system cost through 2032. This credit applies to both residential and commercial installations, dramatically reducing the initial investment burden.
State-level incentives vary significantly but often include performance-based incentives, sales tax exemptions, and property tax exclusions. Many states offer Solar Renewable Energy Certificates (SRECs), allowing system owners to earn additional revenue by selling environmental attributes of their generated electricity.
Utility companies frequently provide rebate programs based on system capacity or expected performance. These programs typically offer direct cash incentives ranging from $0.20 to $1.25 per watt installed, though availability and amounts vary by region and utility provider.
Local governments may offer additional incentives through grant programs, low-interest loans, or expedited permitting processes. Many municipalities have established specific solar incentive programs to promote renewable energy adoption within their jurisdictions.
To maximize available benefits, system owners should carefully evaluate all applicable incentives during the project planning phase, as some programs have limited funding or declining benefit structures over time. Professional consultation with tax advisors and solar specialists ensures optimal utilization of available incentives within current regulatory frameworks.
Net Metering Benefits
Net metering serves as a crucial financial mechanism that significantly enhances the economic viability of solar panel installations. Under this policy, excess electricity generated by solar panels is fed back into the grid, effectively running the utility meter backwards and creating credits on the customer’s electricity bill. These credits can offset future consumption during periods when solar production is lower, such as nighttime or cloudy days.
The financial benefits of net metering manifest in several ways. First, it maximizes the value of solar generation by ensuring that all produced electricity is either used immediately or credited at retail rates. This arrangement typically results in greater savings compared to systems without net metering, where excess production might be compensated at lower wholesale rates or lost entirely.
For most residential and commercial installations, net metering can reduce annual electricity costs by 40-70%, depending on local utility rates and consumption patterns. The policy also helps improve system payback periods, often reducing them by 2-4 years compared to non-net metered installations. Additionally, net metering eliminates the need for expensive battery storage systems in many cases, as the grid effectively serves as a virtual storage solution.
However, it’s important to note that net metering policies vary by state and utility company, affecting the financial returns. Some jurisdictions have implemented time-of-use rates or reduced credit values, which should be carefully considered in financial analyses of solar investments.
Renewable Energy Certificates
Renewable Energy Certificates (RECs) represent the environmental attributes of electricity generated from renewable sources, including solar photovoltaic systems. Each REC typically represents one megawatt-hour (MWh) of clean energy production and can be sold separately from the actual electricity generated, creating an additional revenue stream for solar installations.
In many jurisdictions, RECs play a crucial role in meeting renewable portfolio standards (RPS) and environmental compliance requirements. Utilities and corporations often purchase RECs to fulfill their renewable energy commitments or sustainability goals. The value of RECs varies significantly by market, location, and timing, with prices ranging from a few dollars to over $300 per MWh in some markets.
Solar system owners can monetize their RECs through several channels:
– Direct sales to utilities through power purchase agreements
– Trading on renewable energy markets
– Aggregator services that bundle RECs from multiple sources
– Long-term contracts with corporate buyers
When conducting financial analysis for solar projects, it’s essential to consider REC revenue potential carefully. However, REC prices can be volatile and market-dependent, necessitating conservative projections in financial models. Factors affecting REC values include:
– State-specific RPS requirements
– Supply and demand dynamics
– Regulatory changes
– Market maturity
– Certificate vintage and type
Understanding and accurately forecasting REC revenue can significantly impact a project’s overall financial performance and return on investment calculations.
Risk Assessment and Sensitivity Analysis
Performance Degradation Impact
Solar panel systems experience a gradual decline in performance over time, significantly impacting their long-term financial returns. Modern solar panels typically degrade at a rate of 0.5% to 0.8% annually, meaning a system’s output capacity diminishes by approximately 10-16% over a 20-year period. This degradation affects both energy production capabilities and financial metrics, including payback periods and return on investment calculations.
Several factors contribute to performance degradation, including environmental stress, thermal cycling, and ultraviolet exposure. Premium panels often feature better degradation rates, with some manufacturers guaranteeing performance losses of no more than 0.3% annually. While these panels command higher upfront costs, their superior long-term performance can justify the investment through enhanced energy production and revenue generation.
Financial analysis must account for this gradual efficiency decline when projecting future cash flows. For example, a system initially producing 10,000 kWh annually with a 0.7% degradation rate will generate approximately 9,300 kWh in year 20. This reduction directly impacts savings and revenue calculations, potentially extending payback periods by 6-12 months compared to calculations that ignore degradation effects.
To mitigate financial risks associated with performance degradation, investors should carefully review manufacturer warranties, consider performance guarantees, and factor maintenance costs into their financial models. Regular system monitoring and maintenance can help maintain optimal performance levels and protect long-term investment returns.
Energy Price Volatility
Energy price volatility significantly impacts the financial analysis of solar panel investments, making it a critical factor in ROI calculations. Traditional electricity rates have historically demonstrated considerable fluctuation due to factors such as fuel costs, geopolitical events, and supply-demand dynamics. This volatility directly affects the projected energy cost savings from solar installations.
When conducting financial assessments, analysts typically incorporate various electricity price scenarios to account for this volatility. Historical data shows that utility rates generally increase by 2-4% annually, though specific regions may experience more dramatic changes. Solar installations provide a hedge against these fluctuations by locking in electricity costs for 25-30 years, the typical lifespan of solar panels.
To accurately model the impact of energy price volatility:
– Analyze historical price trends in your specific utility market
– Consider seasonal variations in electricity rates
– Factor in time-of-use pricing structures
– Account for potential regulatory changes affecting utility rates
– Include sensitivity analyses with different price escalation scenarios
Investment analysts often recommend using conservative estimates for future electricity prices while maintaining multiple scenarios to understand the range of possible outcomes. This approach ensures that ROI calculations remain realistic while acknowledging the inherent uncertainty in long-term energy price forecasts.
Maintenance Cost Considerations
While solar panels are known for their durability and minimal maintenance requirements, understanding the long-term maintenance costs is crucial for accurate financial analysis. The typical annual maintenance expense for a residential solar system ranges from 0.5% to 1% of the initial installation cost, though this can vary based on system size and complexity.
Regular maintenance activities include panel cleaning, which may cost $150-300 per service, and periodic inspections averaging $200-400 annually. These services help maintain optimal system efficiency and prevent potential issues that could impact financial returns. Inverter replacement, typically necessary every 10-15 years, represents the most significant maintenance expense, ranging from $1,000 to $2,500 depending on system size.
Performance monitoring systems, while adding to maintenance costs, can help identify efficiency losses early and protect long-term returns. These systems typically cost $100-200 annually but can prevent more costly repairs through early detection of issues.
When calculating ROI, investors should factor in a maintenance reserve of approximately $1,000-1,500 per decade for residential systems and proportionally more for commercial installations. This ensures realistic financial projections and adequate preparation for routine upkeep and potential repairs.
Insurance costs should also be considered, though many homeowner’s policies cover solar installations with minimal premium increases. Professional maintenance contracts, while adding to operational costs, can provide peace of mind and more predictable expenses for budget planning.
Investment Decision Framework
Financial Analysis Tools
Modern financial analysis of solar installations relies heavily on specialized software tools and calculators designed to evaluate investment potential and returns. The National Renewable Energy Laboratory’s System Advisor Model (SAM) stands out as an industry-standard platform, offering comprehensive analysis capabilities for both residential and commercial projects. For detailed insights into various financial modeling approaches, our solar project financing guide provides essential frameworks and methodologies.
PVWatts Calculator offers a streamlined approach for quick energy production estimates and basic financial calculations, while more sophisticated tools like RETScreen Expert integrate detailed climate data and risk analysis capabilities. For investment professionals, platforms like Energy Toolbase and Aurora Solar combine proposal generation with advanced financial modeling, including complex rate structure analysis and incentive calculations.
Excel-based analysis tools remain popular among analysts, with customizable templates available for NPV calculations, LCOE analysis, and sensitivity studies. These tools typically incorporate variables such as degradation rates, maintenance costs, and inflation factors to provide comprehensive long-term projections.
Many utilities and solar installers also offer web-based calculators that help consumers estimate potential savings and ROI, though these tools often serve as preliminary assessment instruments rather than detailed analytical platforms. For academic research and professional analysis, specialized software packages like HOMER Pro provide additional capabilities for hybrid system optimization and detailed financial scenario modeling.
Decision-Making Checklist
To make an informed decision about solar PV investments, follow this systematic evaluation process:
1. Assess Current Energy Consumption
– Review 12 months of electricity bills
– Calculate average monthly and annual usage
– Identify peak consumption periods
– Document current electricity rates
2. Evaluate Site Suitability
– Measure available roof or ground space
– Analyze solar exposure and shading
– Consider roof age and structural integrity
– Verify local zoning regulations and restrictions
3. Calculate Initial Investment
– Request multiple installation quotes
– Include equipment and labor costs
– Factor in permit fees and interconnection costs
– Consider additional structural modifications
4. Research Available Incentives
– Federal Investment Tax Credit (ITC)
– State-specific rebates and grants
– Local utility incentive programs
– Solar Renewable Energy Credits (SRECs)
5. Perform Financial Analysis
– Calculate expected energy production
– Estimate annual savings
– Determine payback period
– Compute ROI and NPV
– Consider financing options and interest rates
6. Assess Risk Factors
– Equipment warranty terms
– Installer credentials and experience
– Maintenance requirements and costs
– Property value impact
– Insurance implications
7. Review Long-term Considerations
– System lifespan expectations
– Degradation rates
– Future electricity rate projections
– Battery storage integration potential
– Grid connection requirements
Document all findings and consult with qualified professionals before making your final investment decision.
Solar panel financial analysis requires a comprehensive understanding of multiple factors to make informed investment decisions. Throughout this examination, we’ve explored essential metrics like ROI, payback periods, and LCOE, which form the foundation of any solar project evaluation. The integration of available incentives, tax credits, and rebates significantly impacts the financial viability of solar installations, while proper risk assessment ensures long-term project success.
To maximize the value of your solar investment, consider these key recommendations: First, conduct thorough site assessments and energy consumption analyses to accurately size your system. Second, obtain multiple quotes from certified installers and compare financing options, including loans, leases, and PPAs. Third, carefully evaluate available incentives and ensure compliance with qualification requirements. Finally, develop a comprehensive maintenance plan to protect your investment and maintain optimal system performance.
Remember that solar financial analysis is not a one-size-fits-all process. Each project requires careful consideration of local factors, regulatory environment, and specific organizational needs. By following these guidelines and maintaining a systematic approach to evaluation, stakeholders can make well-informed decisions that align with their financial and sustainability goals.