Solar power investments deliver compelling returns that extend far beyond mere energy savings, with modern installations achieving ROI periods of 4-8 years and generating 20+ years of positive cash flow. Property owners leveraging current federal tax incentives, state rebates, and optimized system designs can achieve returns exceeding 10-15% annually on their solar investments. Advanced monitoring systems and predictive analytics now enable precise ROI calculations, factoring in variables like electricity rate increases, maintenance costs, and property value appreciation.
This financial analysis becomes particularly relevant as grid electricity costs continue rising at 3-4% annually across most regions, while solar panel efficiency improves and installation costs decline. For commercial properties, accelerated depreciation benefits and demand charge reduction capabilities can reduce payback periods by 20-30% compared to residential installations. Understanding these key performance metrics and financial mechanisms enables property owners to make data-driven decisions about solar investments that align with their long-term energy and financial objectives.
The ROI calculation must consider both quantifiable returns – including energy savings, incentives, and increased property values – and qualitative benefits such as energy independence and environmental impact. This comprehensive approach provides a complete picture of solar power’s true investment value.
Understanding Solar Power Investment Costs
Initial Equipment and Installation Costs
The initial investment in a solar power system comprises several key cost components that significantly impact the overall return on investment. Hardware costs typically account for 50-60% of the total expenditure, with solar panels ranging from $0.70 to $1.50 per watt depending on efficiency and manufacturer. Inverters contribute an additional $0.40 to $0.70 per watt, while mounting hardware and electrical components add approximately $0.30 to $0.50 per watt.
Labor costs constitute 20-30% of the installation budget, varying by region and system complexity. Professional installation ensures optimal performance and compliance with local building codes, typically ranging from $0.50 to $1.00 per watt. Permitting, inspection, and interconnection fees can add $2,000 to $5,000 to the project cost, though these expenses vary significantly by jurisdiction.
For a typical 6kW residential system, total costs generally range from $15,000 to $25,000 before incentives. Various solar financing options can help manage these upfront costs. Federal tax credits currently reduce the net system cost by 30%, while state and local incentives may offer additional savings. Equipment warranties, typically 25 years for panels and 10 years for inverters, protect the investment and ensure long-term performance reliability.
Understanding these initial costs is crucial for calculating accurate ROI projections and determining the most cost-effective system configuration for specific properties and energy needs.
Additional Infrastructure Requirements
Implementing solar power systems often requires significant modifications to existing infrastructure to ensure optimal performance and compliance with regulations. The electrical system typically needs upgrading to accommodate bi-directional power flow, including the installation of smart meters and potentially new electrical panels. Many properties require reinforcement of roof structures to support the additional weight of solar panels, which typically add 2-4 pounds per square foot.
Grid interconnection equipment, including proper disconnects and safety systems, must be installed to meet local utility requirements. Modern inverter systems and monitoring equipment need dedicated space and proper ventilation. Some installations may require underground conduit installation or electrical service upgrades to handle increased capacity.
Storage solutions, such as battery systems, require additional space and specific environmental conditions. Properties may need to modify their electrical rooms or create new spaces to accommodate these components. Proper ventilation systems must be installed to maintain optimal operating temperatures for inverters and batteries.
Building management systems often require integration with solar monitoring platforms, necessitating software upgrades and additional control systems. Safety equipment, including proper grounding systems and lightning protection, must be installed according to current electrical codes. These infrastructure modifications typically represent 15-25% of the total solar installation cost but are essential for system longevity and performance.
Financial Benefits and Savings Analysis
Energy Bill Reduction
Calculating potential energy bill reductions from solar power installations requires a systematic approach that considers multiple variables affecting home energy economics. The primary calculation method involves analyzing current electricity consumption patterns and local utility rates to establish a baseline.
To estimate monthly savings, multiply your average daily kilowatt-hour (kWh) usage by your utility’s per-kWh rate. Then, factor in your solar system’s expected daily energy production, accounting for variables such as panel efficiency, geographic location, and seasonal variations. The difference between your current electricity costs and solar-generated power represents your potential savings.
Annual savings projections should incorporate:
– Historical electricity rate increases (typically 2-3% annually)
– Seasonal production variations
– System degradation factor (approximately 0.5% per year)
– Net metering credits
– Time-of-use rate structures
– Available solar incentives and rebates
For precise calculations, utilize specialized solar calculator tools that integrate local weather data, shading analysis, and utility rate structures. Remember to account for maintenance costs and insurance premiums when determining net savings. Professional energy auditors can provide detailed analysis using advanced modeling software for more accurate long-term projections.
Government Incentives and Tax Benefits
The federal government offers significant financial incentives to encourage solar power adoption, with the Solar Investment Tax Credit (ITC) being the cornerstone benefit. Property owners can claim up to 30% of their total solar installation costs as a tax credit through 2032. Understanding these current solar incentives is crucial for maximizing return on investment.
State and local governments provide additional incentives, including property tax exemptions, sales tax waivers, and performance-based incentives. Many utilities offer net metering programs, allowing solar system owners to earn credits for excess power generation. Solar Renewable Energy Certificates (SRECs) create another revenue stream in participating markets.
To qualify for these benefits, installations must meet specific criteria, including using certified equipment and working with licensed contractors. Commercial installations may access accelerated depreciation through the Modified Accelerated Cost Recovery System (MACRS), significantly improving project economics.
Documentation requirements typically include proof of purchase, installation certification, and system specifications. Many incentives have deadlines or caps, making timely application essential. Professional solar installers often assist with paperwork and ensure compliance with program requirements.
It’s advisable to consult tax professionals and solar specialists to optimize available incentives, as programs and requirements can vary by jurisdiction and change periodically. Proper planning ensures maximum financial benefit from these government support mechanisms.
Net Metering and Energy Credits
Net metering programs represent a crucial financial benefit for solar power system owners, enabling them to receive credits for excess electricity generated and fed back into the grid. When your solar panels produce more power than your property consumes, this surplus energy is measured by a bidirectional meter and credited to your account at a predetermined rate.
The value of these energy credits varies by jurisdiction and utility provider, typically ranging from full retail rate compensation to wholesale electricity prices. Many states mandate that utilities offer net metering, though program structures and compensation rates differ significantly. These variations directly impact your solar investment’s ROI calculation.
Under favorable net metering policies, system owners can effectively use the grid as a virtual battery, drawing from their accumulated credits during periods of low solar production. This arrangement can substantially reduce or eliminate monthly electricity bills, accelerating the payback period of the initial investment.
Some utilities also offer time-of-use (TOU) rates, where electricity values fluctuate throughout the day. Strategic solar system owners can maximize returns by generating excess power during peak rate periods when credits are most valuable. Understanding your local net metering policy, credit rates, and any applicable caps or restrictions is essential for accurately projecting your solar investment’s financial performance.
Calculating Your Solar ROI
Payback Period Calculation
The payback period calculation for solar power systems involves determining the time required for energy savings and incentives to offset the initial investment. This critical metric helps investors understand when their solar installation will begin generating positive returns.
To calculate the payback period, begin by determining the total system cost, including installation and equipment, then subtract available tax credits, rebates, and incentives. Next, estimate annual energy savings by multiplying your current electricity rate by the projected annual solar energy production. Factor in potential increases in electricity rates, which typically rise 2-3% annually, enhancing future savings.
The basic formula is:
Payback Period = (Total System Cost – Incentives) ÷ Annual Energy Savings
However, a comprehensive calculation should consider additional factors:
– System degradation rate (typically 0.5% annually)
– Maintenance costs
– Financing expenses if applicable
– Solar Renewable Energy Credits (SRECs) revenue
– Net metering benefits
Modern solar installations typically achieve payback periods between 5-10 years, depending on location, energy costs, and available incentives. Regions with higher electricity rates and abundant sunshine generally see faster returns. Commercial installations often realize shorter payback periods due to scaled economics and tax advantages.
For maximum accuracy, utilize specialized solar ROI calculators or consult with qualified solar professionals who can provide detailed projections based on your specific circumstances. Remember that while payback period is important, it’s just one component of the overall return on investment analysis.
Long-term Return Projections
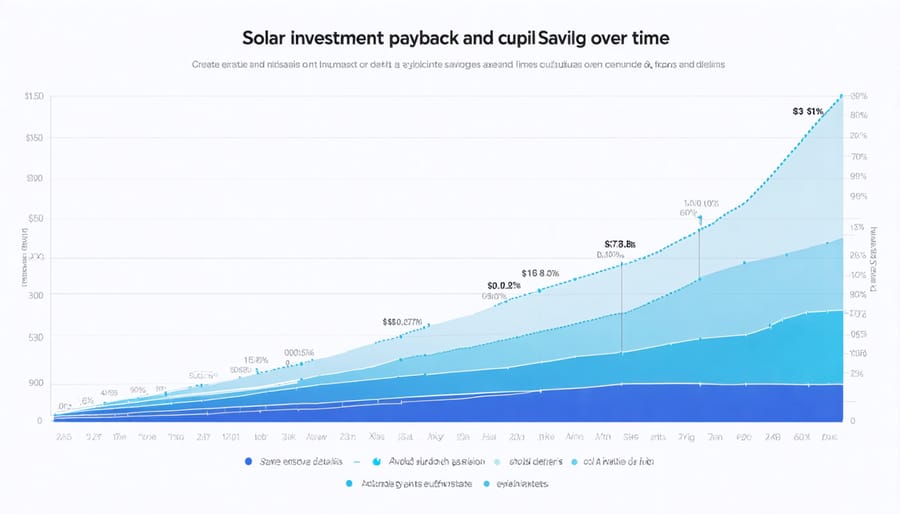
Solar power systems demonstrate remarkable longevity, typically maintaining operational efficiency for 25-30 years, making them an attractive long-term investment. Industry data shows that modern solar panels degrade at a mere 0.5% to 0.8% annually, ensuring sustained performance throughout their lifespan. This reliability, combined with current market trends affecting solar ROI, contributes to predictable long-term returns.
Financial projections indicate that residential solar installations typically achieve complete payback within 5-8 years, followed by 15-20 years of pure cost savings. Commercial installations often demonstrate even more favorable returns due to economies of scale and tax incentives. Analysis of system performance data reveals that a properly maintained solar installation can generate returns of 150-200% over its lifetime when accounting for energy savings, incentives, and increased property value.
The long-term financial benefits extend beyond direct energy savings. Property value appreciation, typically 3-4% for homes with solar installations, provides additional return on investment. Furthermore, protection against rising utility rates, which historically increase 2-3% annually, enhances the system’s value proposition over time.
Recent studies from leading energy research institutions indicate that solar installations maintain 80-85% of their original production capacity after 25 years, exceeding manufacturer warranties. This durability, combined with minimal maintenance requirements and decreasing installation costs, continues to improve the long-term ROI calculations for solar power investments. The environmental benefits, including reduced carbon emissions and decreased dependence on fossil fuels, add intangible value to the quantifiable financial returns.
Factors Affecting Solar ROI
Geographic Location and Climate
The efficiency and return on investment of a solar power system are significantly influenced by its geographic location and local climate conditions. Solar panels perform optimally when exposed to direct sunlight, making locations with high annual solar radiation particularly advantageous. Areas closer to the equator typically receive more consistent sunlight throughout the year, while regions at higher latitudes experience seasonal variations in solar exposure.
Climate factors such as cloud cover, precipitation, and temperature directly impact system performance. While solar panels can still generate electricity on cloudy days, their output may decrease by 10-25% compared to clear conditions. Surprisingly, cooler temperatures actually improve panel efficiency, as excessive heat can reduce performance by 0.3-0.5% per degree Celsius above optimal operating temperatures.
Seasonal changes affect both daylight hours and sun angle, creating variations in energy production throughout the year. For example, northern hemisphere installations typically generate more power during summer months due to longer days and higher sun angles. System designers account for these variations by adjusting panel tilt angles and incorporating weather data into production estimates.
Local weather patterns, including snowfall and extreme weather events, must be considered when calculating ROI. Snow coverage can temporarily reduce output, though panels’ tilted installation often allows for natural clearing. Coastal areas may require additional protection against salt spray, while desert regions might need more frequent cleaning due to dust accumulation.
Modern solar installations often incorporate weather monitoring systems and predictive analytics to optimize performance based on local conditions, helping property owners maximize their return on investment despite geographic and climatic challenges.

Energy Usage Patterns
Understanding energy consumption patterns is crucial for maximizing the return on investment in solar power systems. The way a property consumes electricity directly impacts the effectiveness of decentralized energy systems and their financial returns.
Peak usage timing significantly affects ROI calculations. Properties that consume most of their energy during daylight hours typically achieve better returns, as they can directly utilize generated solar power rather than relying on energy storage systems or grid exchange. This alignment between generation and consumption patterns can reduce the need for expensive battery storage solutions.
Load distribution throughout the day also plays a vital role. Properties with consistent energy usage patterns generally experience more predictable returns compared to those with sporadic consumption. Understanding these patterns helps in properly sizing the solar installation and optimizing system components for maximum financial benefit.
Seasonal variations in energy consumption must be considered when calculating ROI. Winter months often see increased energy demand for heating, while summer peaks may occur due to cooling needs. These seasonal fluctuations affect the overall system performance and financial returns, particularly in regions with distinct seasonal characteristics.
To optimize ROI, property owners should conduct detailed energy audits, implement energy-efficient measures, and consider load-shifting strategies to better align consumption with solar generation periods. Smart energy management systems can help monitor and adjust usage patterns, ensuring optimal utilization of solar-generated power and maximizing financial returns over the system’s lifetime.
Maximizing your solar power ROI requires careful consideration of multiple factors and strategic planning throughout your investment journey. By focusing on system design optimization, selecting high-quality components, and implementing proper maintenance protocols, property owners can significantly enhance their returns on solar investments.
Key considerations for optimal solar ROI include conducting thorough site assessments, securing competitive financing options, and taking advantage of available tax incentives and rebates. Working with certified installers and maintaining detailed documentation of system performance helps ensure long-term financial benefits while minimizing operational risks.
For maximum financial returns, consider implementing the following action steps:
1. Obtain multiple quotes from reputable solar installers to ensure competitive pricing
2. Review your energy consumption patterns and size your system accordingly
3. Investigate local utility policies regarding net metering and power purchase agreements
4. Schedule regular maintenance inspections to maintain system efficiency
5. Monitor system performance through integrated tracking solutions
6. Stay informed about emerging technologies and upgrade opportunities
Remember that ROI calculations should account for both immediate and long-term factors, including potential increases in electricity rates, property value appreciation, and environmental benefits. Regular system monitoring and proactive maintenance will help protect your investment and ensure optimal performance throughout the system’s lifetime.
By following these guidelines and maintaining a long-term perspective, property owners can maximize their solar power investment returns while contributing to a more sustainable energy future. Consider consulting with solar energy professionals to develop a customized strategy that aligns with your specific financial goals and property characteristics.