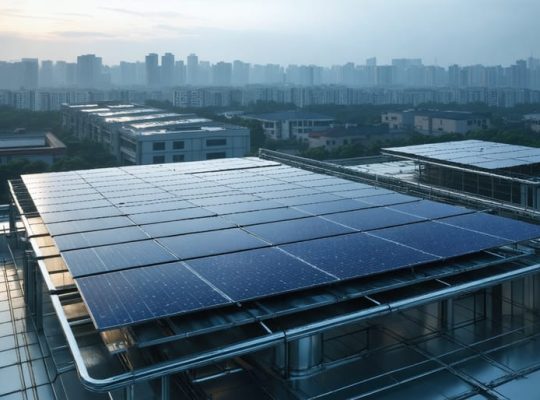
Understanding the true cost of solar photovoltaic (PV) systems requires analyzing multiple critical factors that directly impact the price per kilowatt-hour (kWh). Recent market data reveals that solar PV economics have shifted dramatically, with average costs dropping from $0.30/kWh in 2010 to $0.05-0.15/kWh in 2023, depending on location, system size, and installation parameters.
Modern solar installations deliver increasingly competitive energy costs through improved panel efficiency, reduced manufacturing expenses, and enhanced installation techniques. When evaluating solar PV costs, investors must consider initial capital expenditure, ongoing maintenance requirements, available government incentives, and projected energy production over the system’s 25-30 year lifespan. These factors combine to determine the levelized cost of electricity (LCOE), providing a comprehensive metric for comparing solar power expenses with traditional energy sources.
This analysis explores current market trends, technological advancements, and financial considerations that influence solar PV costs per kWh, offering valuable insights for stakeholders seeking to maximize their renewable energy investments.
Breaking Down Solar PV Cost Components
Initial Installation Costs
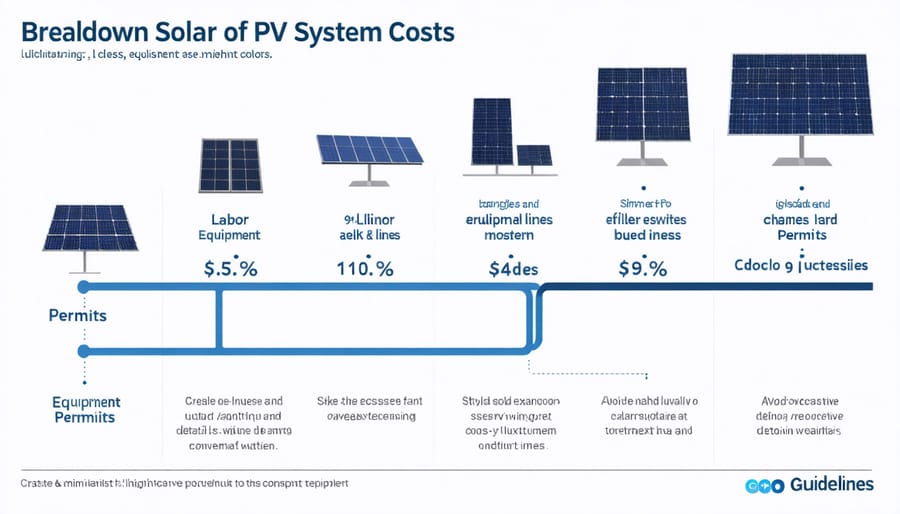
The initial installation costs of a solar PV system comprise several key components that significantly influence the overall cost per kWh. Solar panels typically represent 25-30% of the total system cost, ranging from $0.70 to $1.50 per watt depending on efficiency and manufacturer. Inverters, which convert DC power to AC power, account for approximately 10-15% of the total cost, averaging $0.40 to $0.70 per watt.
Mounting hardware and balance of system components (including wiring, disconnects, and monitoring systems) constitute 15-20% of the installation cost, typically ranging from $0.30 to $0.50 per watt. Labor costs vary by region and installation complexity but generally represent 25-35% of the total cost, averaging $0.50 to $1.00 per watt.
Permitting, inspection, and interconnection fees can add significant expenses, typically ranging from $0.10 to $0.20 per watt. These costs vary substantially by jurisdiction and utility requirements. Engineering and design services account for approximately 5-10% of the total cost, ranging from $0.15 to $0.25 per watt.
For a typical residential 6kW system, total installation costs generally range from $15,000 to $25,000 before incentives and tax credits. Commercial installations benefit from economies of scale, with costs typically 20-30% lower per watt than residential systems. These initial costs form the foundation for calculating the levelized cost of energy (LCOE) over the system’s lifetime.
Operational and Maintenance Expenses
Operational and maintenance (O&M) expenses represent ongoing costs that significantly influence the lifetime cost per kWh of solar PV systems. These expenses typically account for 1-2% of the total system cost annually and include regular maintenance, monitoring, cleaning, and potential component replacements.
Panel cleaning is essential to maintain optimal efficiency, with costs varying by system size, location, and accessibility. In dusty or high-pollution areas, more frequent cleaning may be necessary, increasing annual expenses. Professional cleaning services generally charge $3-7 per panel, though some system owners opt for DIY maintenance to reduce costs.
Inverter replacement represents the most significant long-term maintenance expense, typically necessary every 10-15 years. Modern string inverters cost between $1,000-2,000 for residential systems, while microinverters may have longer lifespans but higher initial costs.
Insurance coverage and monitoring system fees contribute to annual expenses. Monthly monitoring services range from $10-50, providing vital performance data and early problem detection. Additionally, periodic inspections by qualified technicians ensure system safety and efficiency, typically costing $150-300 per visit.
Component repairs or replacements may be necessary due to weather damage, equipment failure, or normal wear. While most major components carry warranties of 25 years or more, labor costs for repairs remain the system owner’s responsibility.
Calculating True Cost per kWh
Levelized Cost of Energy (LCOE)
The Levelized Cost of Energy (LCOE) serves as a standardized metric for comparing different energy generation technologies, including solar photovoltaic systems. This comprehensive measurement accounts for all costs associated with constructing, operating, and maintaining a solar installation over its entire lifetime, divided by the total energy output during that period.
To calculate LCOE for solar PV systems, analysts consider several key components: initial capital costs, ongoing operation and maintenance expenses, financing costs, and system degradation rates. The formula incorporates these factors along with the projected energy generation to determine the cost per kilowatt-hour (kWh) over the system’s lifetime, typically 25-30 years.
The basic LCOE calculation can be expressed as:
LCOE = (Total lifetime costs) ÷ (Total lifetime energy production)
When you calculate your solar ROI, LCOE provides crucial insights into the long-term economic viability of your investment. Modern solar installations typically achieve LCOE values ranging from $0.04 to $0.10 per kWh, depending on geographical location, system size, and local incentives.
Variables affecting LCOE calculations include:
– Solar resource availability
– System efficiency
– Installation costs
– Operation and maintenance requirements
– Financial parameters (interest rates, inflation)
– Local electricity rates
– Available incentives and rebates
Understanding LCOE helps stakeholders make informed decisions by providing a clear picture of the total cost implications throughout the system’s operational lifetime, enabling accurate comparisons with alternative energy sources.
Regional Variations and Influencing Factors
The cost of solar PV per kWh varies significantly across different regions due to multiple geographic and environmental factors. Solar irradiance levels play a primary role, with locations receiving more direct sunlight throughout the year achieving better energy yields and lower per-kWh costs. For instance, desert regions typically experience 30-40% higher solar energy production compared to temperate zones.
Local climate conditions, including temperature, humidity, and precipitation patterns, also impact system efficiency and maintenance requirements. While solar panels operate more efficiently in cooler temperatures, excessive heat can reduce performance by 0.3-0.5% per degree Celsius above standard testing conditions.
Infrastructure development and grid connectivity influence installation costs substantially. Urban areas with established electrical infrastructure often benefit from lower installation costs, while remote locations may require additional equipment and labor for grid connection. Labor costs vary by region, with installation expenses in metropolitan areas typically 15-25% higher than in rural locations.
Government policies and incentives create significant regional cost variations. Countries and regions with strong solar support programs, such as feed-in tariffs or tax incentives, generally demonstrate lower overall costs per kWh. For example, regions with robust net metering policies often achieve payback periods 2-3 years shorter than areas without such programs.
Market maturity and competition among installers also affect pricing. Established solar markets typically offer more competitive pricing due to operational efficiencies and economies of scale. The availability of skilled technicians and installation professionals in a region can impact both initial costs and long-term maintenance expenses, with variations of up to 20% in installation costs between different markets.
ROI Analysis and Payback Period
Financial Incentives and Tax Benefits
Financial incentives and tax benefits significantly impact the overall cost-effectiveness of solar PV systems, making them more accessible through various smart solar financing options. The federal Investment Tax Credit (ITC) remains one of the most substantial incentives, allowing system owners to deduct 30% of their installation costs from their federal taxes through 2032. This credit directly reduces the effective cost per kWh of solar-generated electricity.
State-level incentives vary significantly but often include performance-based incentives, rebates, and property tax exemptions. Many utilities offer additional rebates and net metering programs, enabling system owners to receive credits for excess energy production. Solar Renewable Energy Certificates (SRECs) provide another revenue stream in eligible markets, where system owners can sell certificates representing their clean energy production.
Commercial installations may qualify for accelerated depreciation through the Modified Accelerated Cost Recovery System (MACRS), allowing businesses to depreciate their solar assets over five years. Local governments frequently offer additional incentives, such as expedited permitting processes and reduced fees, further improving the financial proposition of solar PV installations.
When calculating the true cost per kWh, these incentives must be factored into the total system cost, potentially reducing the effective rate by 40-60% compared to the initial investment. Regular policy updates and program availability checks are essential for maximizing available benefits.
Energy Savings Calculations
Calculating long-term energy savings from solar PV systems involves several key variables and methodologies. Understanding these solar power financial models is crucial for accurate cost projections and investment planning.
The primary calculation begins with your current electricity consumption in kWh per year, multiplied by your local utility rates. This baseline is compared against the projected solar system output, accounting for factors such as panel degradation (typically 0.5-1% annually), seasonal variations, and system efficiency.
To determine lifetime savings, consider:
– Annual energy production (kWh)
– Current electricity rates and projected increases (historically 2-3% annually)
– System degradation over time
– Maintenance costs
– Available incentives and tax benefits
– Net metering credits
The formula for annual savings is:
(Annual Solar Production × Electricity Rate) + (Net Metering Credits) – (Annual Maintenance Costs)
For lifetime savings, multiply this by the system’s expected lifespan (typically 25-30 years), adjusting for degradation and rate increases. Remember to factor in the initial investment and any financing costs to calculate net savings. Many modern monitoring systems provide real-time data to track actual versus projected savings, allowing for more accurate long-term forecasting.
System Longevity and Value Appreciation
Solar PV systems demonstrate remarkable longevity, typically maintaining operational efficiency for 25-30 years, with many systems exceeding their warranty periods. This extended lifespan significantly enhances the return on investment and contributes to lower lifetime costs per kWh. Modern solar panels generally degrade at a rate of only 0.5% to 0.8% annually, ensuring sustained performance throughout their operational life.
Property value appreciation represents another crucial long-term benefit of solar PV installation. Research indicates that homes equipped with solar systems command premium prices, with average increases ranging from 3% to 4% compared to non-solar properties. This appreciation translates to approximately $15,000 for a median-priced home, effectively offsetting a substantial portion of the initial installation costs.
The system’s durability is further enhanced by minimal maintenance requirements, typically involving annual inspections and occasional cleaning. Most manufacturers provide performance warranties extending to 25 years, while inverters generally carry 10-15 year warranties. These guarantees, combined with the system’s proven reliability, make solar PV a secure long-term investment.
From an economic perspective, solar PV systems become increasingly valuable as utility rates rise. Historical data shows electricity costs increasing by approximately 2.2% annually, making the fixed-cost nature of solar generation progressively more advantageous. This price stability, coupled with the system’s long operational life, creates a compelling value proposition for property owners considering solar installation.
The cost of solar PV per kilowatt-hour continues to demonstrate a compelling value proposition for diverse stakeholders across the renewable energy landscape. As we’ve explored throughout this analysis, several key factors influence the final cost metrics, including installation expenses, technological improvements, geographic location, and available incentives.
Current market trends indicate that solar PV systems consistently deliver electricity at rates between $0.04 and $0.10 per kWh in most regions, representing a significant improvement from historical costs and offering competitive advantages over traditional energy sources. This downward cost trajectory, coupled with increasing system efficiencies and longer operational lifespans, strengthens the economic case for solar PV investment.
For potential investors considering solar PV implementation, several actionable recommendations emerge from our analysis:
1. Conduct a thorough site assessment to determine optimal system sizing and configuration
2. Research available local and federal incentives to maximize financial benefits
3. Compare multiple quotes from certified installers to ensure competitive pricing
4. Consider the long-term perspective, factoring in both immediate costs and lifetime value
5. Evaluate financing options, including power purchase agreements and lease arrangements
6. Account for maintenance requirements and associated costs in total calculations
Looking ahead, the solar PV sector is positioned for continued cost reductions through technological advancement, manufacturing scale improvements, and increased market competition. However, investors should remain mindful of potential market fluctuations, policy changes, and regional variations that may impact project economics.
The decision to invest in solar PV technology should be based on comprehensive analysis of site-specific factors, available resources, and organizational objectives. While initial capital requirements remain significant, the demonstrable trend toward lower costs per kWh, combined with environmental benefits and energy independence, makes solar PV an increasingly attractive option for both commercial and residential applications.
By carefully considering these factors and working with qualified professionals, stakeholders can develop solar PV projects that deliver optimal value and contribute to a more sustainable energy future.