**Understand that operations and maintenance (O&M) costs represent the difference between projected solar returns and actual profitability.** Industry data shows O&M expenses typically range from $15-25 per kilowatt annually for utility-scale installations and $20-35/kW for commercial systems, consuming 15-20% of total lifetime project costs. Factor these recurring expenditures into comprehensive solar PV ROI calculations from day one, as underestimating maintenance requirements can erode returns by 2-3 percentage points annually over a system’s 25-year lifespan.
**Distinguish between preventive and corrective maintenance cost structures to build accurate financial models.** Preventive activities—including panel cleaning, inverter inspections, and performance monitoring—account for 40-50% of O&M budgets and remain relatively predictable. Corrective maintenance addresses equipment failures and degradation, introducing cost variability that sophisticated investors mitigate through warranty analysis and contingency reserves of 0.5-1.0% of total capital expenditure annually.
**Recognize that technological advancements and operational strategies are fundamentally reshaping the O&M cost landscape.** Remote monitoring systems, predictive analytics, and advanced module designs have driven utility-scale O&M costs down 30-40% over the past decade. Strategic decisions regarding self-performance versus contracted services, preventive maintenance intervals, and equipment quality directly impact both immediate expenses and long-term system performance—making O&M optimization essential for maximizing investment returns in an increasingly competitive renewable energy marketplace.
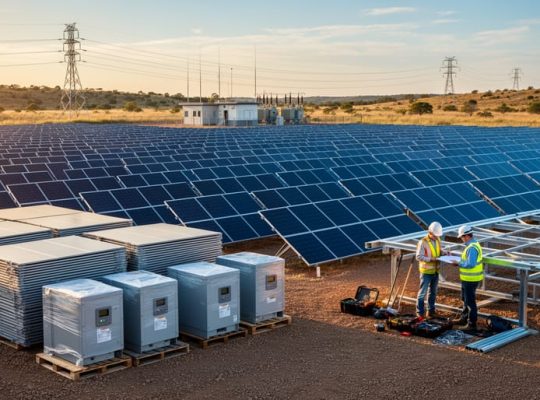
Understanding O&M Costs in Solar PV Systems

What Operations and Maintenance Actually Includes
Operations and Maintenance (O&M) encompasses two distinct yet interconnected cost categories that collectively determine the ongoing expenses of solar PV systems throughout their operational lifetime.
**Operational costs** represent the day-to-day expenses required to keep systems functioning optimally. Monitoring services typically account for 10-15% of total O&M budgets, utilizing SCADA systems and performance analytics platforms to track generation data, identify anomalies, and ensure peak performance. Regular inspections—both visual and thermal—occur quarterly or semi-annually, examining module condition, mounting structures, and electrical connections. Insurance premiums protect against property damage, business interruption, and liability claims, generally ranging from 0.25-0.5% of total project value annually. Administrative costs include asset management, reporting, regulatory compliance, and financial management activities essential for commercial-scale operations.
**Maintenance costs** fall into three strategic categories. Preventive maintenance involves scheduled activities designed to avoid equipment failures: inverter filter replacements, torque checks on electrical connections, vegetation management, and module cleaning where cost-justified. These proactive measures typically consume 40-50% of maintenance budgets. Corrective maintenance addresses unexpected failures—replacing damaged modules, repairing inverters, or fixing tracker components—and can vary significantly based on equipment quality and environmental conditions. Predictive maintenance represents the emerging frontier, leveraging artificial intelligence, drone inspections, and advanced analytics to anticipate component failures before they occur, potentially reducing unplanned downtime by 30-40% while optimizing maintenance scheduling and resource allocation.
Together, these components typically total $15-25 per kilowatt annually for utility-scale installations, with variations based on system size, technology type, and regional factors.
Typical O&M Cost Ranges for Different System Sizes
Understanding typical O&M cost ranges across different system sizes provides essential benchmarks for financial planning and ROI calculations. Current market data reveals significant economies of scale as installation capacity increases.
**Residential systems** (3-10 kW) typically incur the highest per-kilowatt O&M costs, ranging from **$20-$30 per kW per year**. These costs reflect the proportionally higher inspection and maintenance expenses for smaller installations, along with inverter replacements that represent a larger percentage of total system value. Homeowners often pay premium rates for service calls due to lower technician efficiency across distributed assets.
**Commercial installations** (50-500 kW) demonstrate improved cost efficiency, with O&M expenses ranging from **$12-$18 per kW per year**. These mid-scale systems benefit from consolidated maintenance activities while maintaining manageable complexity. Commercial facilities often establish service contracts that provide predictable annual costs and prioritized response times.
**Utility-scale projects** (1 MW and above) achieve the lowest per-kilowatt costs at **$6-$12 per kW per year**. Large-scale operations leverage dedicated maintenance teams, automated monitoring systems, and bulk purchasing power for replacement components. These facilities typically employ sophisticated asset management software and can negotiate favorable long-term service agreements.
Geographic location significantly influences these ranges, with remote installations incurring 15-25% higher costs due to travel time and logistics. Additionally, harsh environmental conditions—such as desert dust, coastal salt exposure, or heavy snowfall—may push costs toward the upper end of each range. These benchmarks represent fully operational systems under standard service agreements, providing reliable planning parameters for comprehensive financial modeling.
Major O&M Cost Components and Their Financial Impact
Preventive Maintenance and Inspection Schedules
Preventive maintenance represents a strategic investment that significantly reduces long-term O&M costs by identifying issues before they escalate into expensive failures. Industry data indicates that preventive programs typically account for 30-40% of total O&M expenditures but can reduce reactive maintenance costs by up to 60%.
**Routine cleaning** forms the foundation of preventive maintenance, with costs ranging from $0.10 to $0.35 per watt annually depending on location, soiling rates, and accessibility. Sites in arid or agricultural regions require more frequent cleaning to combat dust accumulation that can reduce energy output by 15-25%.
**Thermal imaging inspections**, conducted semi-annually or annually, cost approximately $500-$1,500 per megawatt and detect hot spots, faulty bypass diodes, and cell degradation invisible to visual inspection. These infrared scans prevent potential fire hazards and identify underperforming modules early.
**Electrical testing protocols** including I-V curve tracing, insulation resistance testing, and ground continuity verification typically run $800-$2,000 per MW annually. These diagnostics verify system performance against manufacturer specifications and identify electrical faults, connection issues, or potential safety hazards.
Comprehensive inspection schedules aligned with manufacturer warranties and insurance requirements ensure system longevity while maintaining coverage validity—a critical consideration for project financing and asset valuation throughout the 25-30 year operational lifetime.
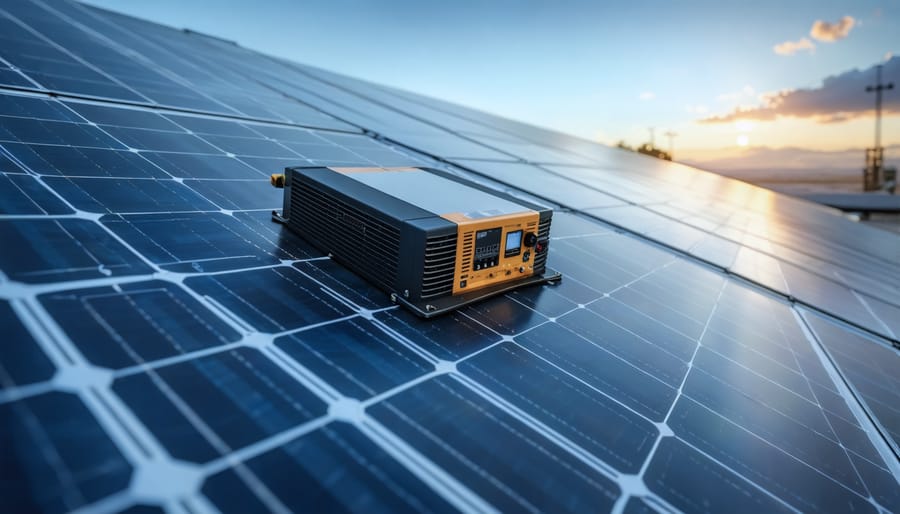
Equipment Replacement and Corrective Repairs
Solar PV systems require strategic equipment replacement planning to maintain optimal performance throughout their operational lifetime. Inverters typically necessitate replacement every 10-15 years, representing one of the most significant O&M expenses. Central inverters cost between $0.10-$0.15 per watt, while microinverters and string inverters vary based on system configuration. Budget approximately 8-12% of initial capital costs for inverter replacements over a 25-year period.
Module degradation, though gradual at 0.5-0.8% annually for quality panels, occasionally requires corrective intervention. Hot spots, delamination, or physical damage from weather events may necessitate individual panel replacements at $150-$300 per module, including labor. Electrical component failures—including combiner boxes, DC disconnect switches, and wiring connections—occur less predictably but demand immediate attention to prevent system downtime.
Emergency repair costs average $5,000-$15,000 annually for utility-scale installations, though proactive maintenance significantly reduces these incidents. Establishing contingency reserves of 0.5-1.0% of total project costs annually ensures financial preparedness for unexpected failures. Advanced monitoring systems enable early fault detection, transforming potentially expensive emergency repairs into planned maintenance activities, thereby optimizing both system availability and long-term financial performance for investors and facility managers conducting feasibility analyses.
Performance Monitoring and Data Management
Modern solar PV facilities require sophisticated monitoring systems to ensure optimal performance and maximize return on investment. Performance monitoring and data management typically account for $1-3 per kW annually, representing a modest but essential component of O&M budgets.
Monitoring software platforms collect real-time data on energy production, weather conditions, equipment status, and system efficiency. These systems enable operators to identify underperforming modules, detect anomalies, and predict maintenance needs before they escalate into costly repairs. Remote diagnostics capabilities reduce site visits by 30-40%, significantly lowering operational expenses.
Advanced analytics tools process vast quantities of performance data to benchmark against expected yields and identify optimization opportunities. Universities collaborating with solar operators increasingly utilize this data for research purposes, contributing to industry-wide performance improvements.
Cloud-based monitoring solutions have become standard, offering scalability and integration with SCADA systems. Subscription-based pricing models typically range from $500-2,000 annually for residential systems and $5,000-15,000 for commercial installations. These investments deliver measurable value through enhanced uptime, faster fault resolution, and data-driven decision-making that directly impacts system profitability over the project lifecycle.
Insurance, Warranties, and Administrative Expenses
Insurance premiums represent a critical recurring expense, typically costing 0.25-0.50% of total system value annually to protect against property damage, business interruption, and liability claims. Comprehensive coverage should address equipment failure, natural disasters, theft, and third-party liability, with premiums varying based on location, system size, and historical weather patterns.
Extended warranty costs beyond standard manufacturer coverage provide financial protection for inverters and other components prone to failure. While initial equipment warranties may cover 10-25 years for panels and 5-10 years for inverters, extended service agreements typically cost 1-3% of equipment replacement value but can prevent unexpected capital outlays.
Property management fees and regulatory compliance expenses encompass permit renewals, interconnection agreement maintenance, and reporting requirements mandated by utilities or regulatory bodies. These administrative costs, though modest individually, accumulate to approximately 0.1-0.3% of system costs annually. Professional asset management services streamline these obligations while ensuring adherence to evolving grid codes and environmental regulations, ultimately protecting project economics and maintaining performance guarantees essential for achieving projected returns over the system’s operational lifetime.
How O&M Costs Affect Solar PV ROI and Payback Periods

Calculating Levelized Cost of Energy (LCOE) with O&M
The levelized cost of energy (LCOE) represents the per-kilowatt-hour cost of building and operating a solar facility over its entire lifetime. Incorporating O&M costs accurately is essential for realistic financial projections and investment decisions.
The LCOE formula incorporating O&M follows this methodology:
**LCOE = (Initial Capital Investment + Present Value of O&M Costs) / Lifetime Energy Production**
To calculate precisely, project developers should:
1. **Sum all capital expenditures** including equipment, installation, and grid connection costs
2. **Calculate annual O&M expenses** covering routine maintenance, repairs, monitoring, insurance, and land lease payments
3. **Apply discount rate** (typically 3-8%) to future O&M costs to determine present value
4. **Project total energy output** over system lifetime, accounting for degradation (approximately 0.5% annually)
5. **Divide total costs by lifetime production** to derive LCOE per kWh
**Example Scenario:** A 1 MW ground-mounted system with $1 million capital cost, $15,000 annual O&M expenses, 6% discount rate, and 25-year lifespan producing 1,500 MWh annually (degrading) yields an LCOE of approximately $0.045/kWh.
When O&M costs increase by 50% to $22,500 annually, LCOE rises to $0.049/kWh—demonstrating how operational efficiency directly impacts competitiveness against conventional energy sources. University research collaborations continue refining these methodologies, enabling stakeholders to make data-driven decisions about system design and maintenance strategies.
O&M Impact on Net Present Value and Internal Rate of Return
Operations and maintenance costs significantly influence the financial viability of solar PV projects, directly affecting NPV and IRR projections over typical 25-year system lifetimes. Even modest variations in O&M assumptions can create substantial differences in investment returns, making accurate cost forecasting essential for sound financial planning.
Consider a 1 MW commercial solar installation with a $1 million initial investment. With conservative O&M costs at $20,000 annually (2% of capital expenditure), the project might achieve an IRR of 8.5% and an NPV of $450,000 at a 6% discount rate. However, if actual O&M costs reach $30,000 annually—perhaps due to unexpected equipment failures or higher-than-anticipated labor costs—the IRR drops to approximately 7.2%, and NPV decreases to $320,000, representing a 29% reduction in net present value.
Sensitivity analysis reveals that O&M costs typically rank among the top three variables affecting project economics, alongside energy production and electricity prices. A 50% increase in O&M expenses can reduce IRR by 1-2 percentage points, potentially making marginal projects financially unfeasible. Universities conducting renewable energy research have documented that projects with proactive maintenance strategies—including regular inverter servicing, panel cleaning schedules, and performance monitoring—consistently achieve 15-25% lower lifecycle O&M costs compared to reactive approaches.
Smart investors perform Monte Carlo simulations incorporating O&M cost variability, typically modeling scenarios ranging from optimistic (1.5% of CAPEX annually) to pessimistic (3.5% of CAPEX annually). This comprehensive approach ensures stakeholders understand the full spectrum of potential outcomes and can structure financing accordingly, building appropriate contingencies into project budgets while maintaining competitive returns.
Strategies to Minimize O&M Costs Without Compromising Performance
Technology Selection and System Design Considerations
Component selection decisions made during system design fundamentally shape operational expenditure profiles throughout a solar installation’s lifecycle. Monocrystalline modules, while commanding higher upfront costs compared to multi-crystalline alternatives, typically exhibit superior degradation rates (0.3-0.5% annually versus 0.5-0.8%) and enhanced temperature coefficients, translating to fewer performance-related interventions and extended productive lifespans. This quality differential directly influences long-term maintenance budgets and system availability.
Inverter architecture presents equally significant O&M implications. String inverters offer economies of scale and centralized maintenance access, yet single-point failures can compromise entire array sections. Module-level power electronics—including microinverters and DC optimizers—distribute risk across individual panels, enabling granular monitoring and isolated troubleshooting. While these distributed solutions increase initial investment by 15-25%, they often reduce diagnostic complexity and minimize production losses during repairs, potentially offsetting higher component replacement costs through improved uptime metrics.
Racking system quality similarly affects maintenance requirements. Premium mounting solutions featuring corrosion-resistant materials, robust structural engineering, and compatibility with vegetation management equipment reduce recurring inspection and repair needs. Collaborative research from leading universities demonstrates that specifying proven components with comprehensive warranties establishes predictable maintenance schedules, supporting accurate ROI modeling and reducing financial uncertainty for stakeholders across commercial, utility-scale, and distributed generation applications.
Proactive Monitoring and Predictive Maintenance
Modern solar operations increasingly leverage advanced data analytics and artificial intelligence to transition from reactive to proactive maintenance strategies, significantly reducing O&M costs while maximizing system uptime. Predictive maintenance systems analyze real-time performance data from inverters, sensors, and weather stations to identify potential failures before they occur, allowing operators to schedule targeted interventions during planned maintenance windows rather than responding to costly emergency breakdowns.
AI-driven diagnostics can detect subtle performance degradation patterns—such as gradual inverter efficiency losses or developing hot spots in PV modules—that might escape routine visual inspections. By establishing baseline performance metrics and continuously monitoring deviations, these systems enable condition-based maintenance schedules optimized around actual equipment status rather than arbitrary time intervals.
Universities collaborating with solar operators are developing increasingly sophisticated algorithms that integrate historical performance data with machine learning models to forecast equipment failures with remarkable accuracy. This approach can reduce unplanned downtime by 30-50% and extend equipment lifespan through timely preventive interventions. For large-scale installations, implementing predictive maintenance platforms typically requires initial investment in monitoring hardware and software, but delivers measurable ROI through reduced truck rolls, optimized spare parts inventory, and minimized production losses from unexpected failures.
O&M Contract Structures and Service Level Agreements
Solar PV operators face a fundamental choice between in-house maintenance teams and third-party O&M contracts. In-house operations offer direct control and potentially lower long-term costs for large portfolios, but require significant upfront investment in personnel, training, and equipment. Third-party contracts provide specialized expertise and scalability, particularly valuable for smaller installations or geographically dispersed assets.
O&M agreements typically follow two structures: fixed-price contracts guarantee predictable annual costs regardless of system performance, simplifying budgeting alongside solar financing options. Performance-based agreements align contractor incentives with system output, sharing savings or penalties based on availability targets, making them attractive for maximizing generation revenue.
Comprehensive Service Level Agreements should specify response times for different fault categories (typically 4-24 hours for critical issues), minimum system availability guarantees (commonly 97-99%), preventive maintenance schedules, reporting requirements, and performance measurement methodologies. SLAs must clearly define responsibilities for component replacements, warranty claims management, vegetation control, and emergency repairs.
Performance-based contracts increasingly incorporate energy yield guarantees referenced against meteorological models, creating accountability for optimization efforts. When evaluating contracts, consider the provider’s technical capabilities, regional service infrastructure, insurance coverage, and financial stability to ensure long-term partnership viability throughout your system’s operational lifetime.
Industry Trends Shaping Future O&M Costs
Automation, Robotics, and Remote Diagnostics
Technological advancement is fundamentally reshaping solar PV maintenance economics by reducing labor-intensive procedures and enabling predictive interventions. Drone-based inspections now accomplish in hours what previously required days of manual surveying, utilizing thermal imaging cameras to detect hotspots, micro-cracks, and electrical anomalies across utility-scale installations. These aerial assessments typically cost 40-60% less than traditional ground-based inspections while delivering superior diagnostic accuracy.
Robotic cleaning systems represent another significant cost-reduction opportunity, particularly for installations in dusty or arid environments where soiling losses can exceed 20% annually. Automated cleaning platforms eliminate the need for water trucks and manual labor crews, reducing cleaning costs by approximately 30-50% while minimizing water consumption—a critical consideration in water-scarce regions.
Remote monitoring platforms integrating artificial intelligence and machine learning algorithms enable facility managers to transition from reactive to predictive maintenance strategies. These systems continuously analyze performance data, weather patterns, and equipment behavior to forecast potential failures before they occur. This proactive approach reduces downtime costs, extends component lifespans, and optimizes technician deployment schedules. Research from university partnerships demonstrates that facilities implementing comprehensive remote diagnostics achieve 15-25% reductions in annual O&M expenses compared to conventional maintenance protocols.

Improved Component Reliability and Extended Warranties
The solar PV industry has witnessed remarkable advances in component durability, fundamentally reshaping long-term O&M cost projections. Manufacturers now routinely offer 30-year performance warranties on photovoltaic modules, with some extending to 40 years, compared to the 20-25 year standards of the previous decade. This extended coverage reduces replacement expenses and provides greater financial predictability for system owners and investors conducting lifecycle cost analyses.
Inverter technology has similarly evolved, with string inverters now achieving 15-20 year operational lifespans and microinverters reaching 25+ years through improved thermal management and component quality. These improvements significantly reduce the frequency of inverter replacements—historically one of the largest O&M expense categories—thereby lowering total cost of ownership calculations.
Material science innovations have produced more weather-resistant encapsulants, corrosion-proof frames, and UV-stabilized backsheets that maintain structural integrity in harsh environmental conditions. Field data increasingly demonstrates that well-manufactured systems can operate efficiently beyond their warranty periods with minimal degradation, often exceeding initial performance expectations. For financial modeling purposes, these reliability improvements justify lower annual O&M budget allocations while simultaneously extending revenue-generating asset lifespans, creating compelling ROI scenarios for solar investments across residential, commercial, and utility-scale applications.
Effective O&M cost management stands as the critical differentiator between solar PV investments that meet or exceed financial projections and those that underperform. While upfront capital expenditures understandably dominate initial decision-making, the cumulative impact of operational expenses over a system’s 25-30 year lifespan fundamentally shapes actual returns. Industry data demonstrates that well-managed systems with proactive maintenance protocols consistently achieve performance ratios above 80%, while neglected installations may fall below 70%—a difference that directly translates to significant revenue variations.
Strategic O&M planning requires comprehensive consideration of preventive maintenance schedules, performance monitoring infrastructure, inverter replacement reserves, and evolving technology opportunities. Forward-thinking project developers integrate these factors during the design phase rather than treating them as afterthoughts. This approach enables accurate financial modeling and establishes realistic expectations for long-term system economics.
The solar industry continues advancing rapidly, with emerging technologies and refined best practices reshaping operational strategies. Professionals committed to maximizing solar asset value must stay informed about these developments through continued education and knowledge sharing. Mose Solar offers extensive educational resources specifically designed for industry stakeholders seeking deeper expertise in system optimization and lifecycle management. These materials, developed in collaboration with academic institutions, provide evidence-based insights that bridge theoretical understanding and practical application.
Ultimately, disciplined O&M execution separates successful solar projects from mediocre ones. Organizations that prioritize operational excellence position themselves to capture the full economic and environmental benefits that solar photovoltaic technology promises.