Private equity investments follow a predictable financial pattern known as the J-curve, where portfolio values initially decline before ascending to profitability—a phenomenon critically important for solar photovoltaic project financing. During the early stages, investors experience negative returns as capital flows out for project development, equipment procurement, and installation costs while revenue generation remains minimal or nonexistent. This temporary value erosion typically persists for 18 to 36 months in solar projects before the inflection point occurs and cash flows turn positive.
Understanding this capital deployment trajectory becomes essential when evaluating solar PV investments, particularly as interest rate environments directly influence both the depth and duration of the J-curve’s valley. Higher borrowing costs extend the negative return period and steepen initial losses, while favorable capital market conditions can compress the timeline to profitability. For aspiring photovoltaic professionals and renewable energy investors, recognizing how the J-curve manifests differently across varying economic climates enables more accurate project valuations and realistic return expectations.
The solar industry’s maturation has modified traditional J-curve dynamics through technological improvements, streamlined installation processes, and enhanced grid interconnection procedures. Yet fundamental economics remain: substantial upfront capital requirements precede decades of operational cash generation. This temporal mismatch between investment and returns requires sophisticated financial modeling that accounts for discount rates, degradation curves, and merchant power price volatility—competencies that distinguish successful renewable energy finance professionals from conventional analysts.
What Is the J-Curve in Private Equity?
The Three Phases of the J-Curve
The J-curve in private equity unfolds across three distinct phases that directly impact investment performance and cash flow dynamics. Understanding these phases is essential for evaluating solar photovoltaic projects and other renewable energy investments.
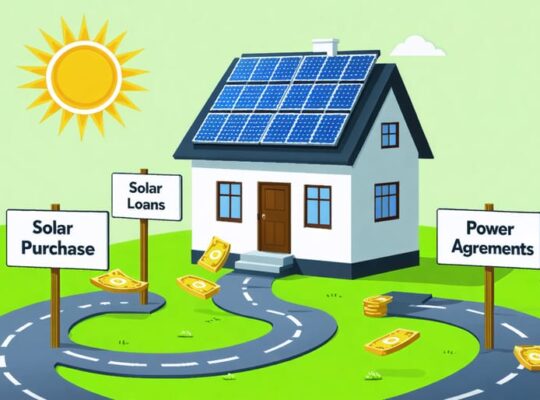
The Investment Phase marks the initial period when capital is actively deployed into the project or fund. During this stage, investors experience negative returns as funds flow outward to cover acquisition costs, development expenses, and operational setup. For solar installations, this includes equipment procurement, site preparation, and interconnection fees. Management fees and transaction costs further deepen the initial value decline, creating the downward slope of the J-curve.
The Value Creation Phase represents the transition period where deployed capital begins generating returns through operational improvements and strategic development. Solar projects enter commercial operation, producing electricity and revenue streams. This phase involves optimizing system performance, securing power purchase agreements, and implementing efficiency enhancements. The integration of solar financial modeling becomes critical for tracking performance metrics and adjusting operational strategies to accelerate the upward trajectory.
The Harvest Phase occurs when cumulative returns surpass initial investments, bringing the curve above its starting point. Solar assets reach stable cash flow generation, with reduced maintenance costs and proven operational track records. Exit opportunities emerge through asset sales, refinancing, or dividend distributions. Success in this phase depends on factors including energy production consistency, market conditions, and strategic timing of asset monetization, ultimately determining whether the investment achieves its targeted internal rate of return.
Why Solar PV Projects Follow This Pattern
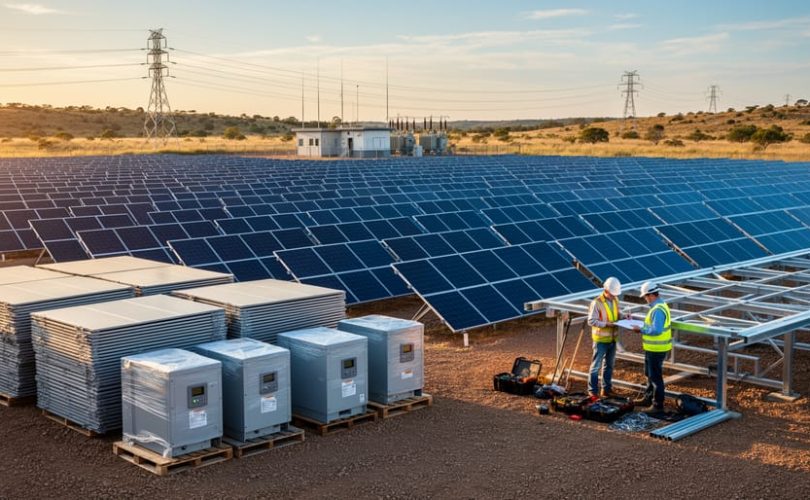
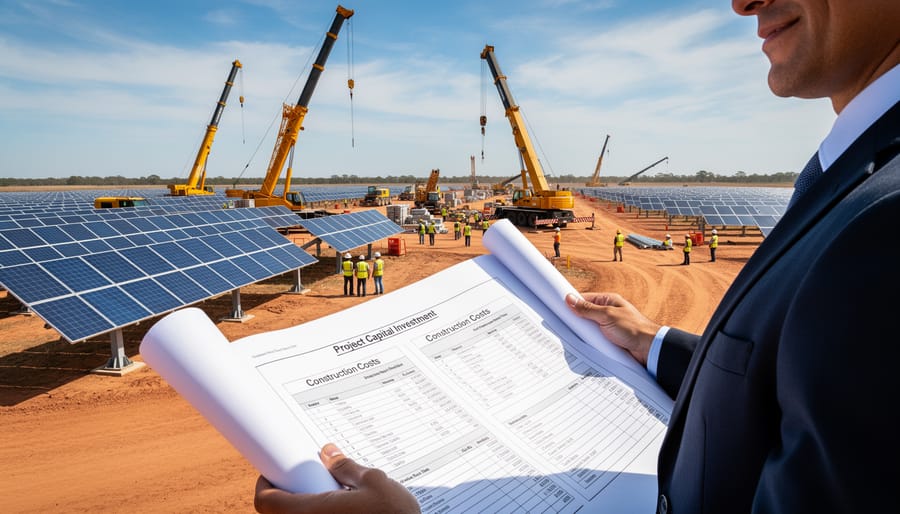
Solar photovoltaic projects exemplify the J-curve phenomenon through their distinctive investment timeline and cash flow characteristics. The initial phase requires substantial capital expenditure across multiple categories. Equipment procurement represents the largest upfront cost, encompassing solar panels, inverters, mounting systems, and balance-of-system components. Development expenses follow, including site assessment, engineering studies, and environmental impact evaluations.
Permitting and regulatory compliance add another layer of initial costs, as projects must navigate complex approval processes at local, state, and federal levels. These administrative requirements can extend timelines and increase financial burden before any revenue generation occurs. Construction periods typically span six to eighteen months, during which investors continue funding operations without incoming cash flows.
The trough of the J-curve deepens as interest payments on project debt accumulate during construction. Grid interconnection fees and commissioning activities further drain capital reserves. Only after commercial operation begins do projects transition toward positive returns through power purchase agreements or wholesale electricity sales. This pattern makes solar PV investments particularly sensitive to interest rate environments, as higher financing costs extend the negative return period and steepen the initial descent of the J-curve trajectory.
Capital Markets Dynamics and Solar PV Investments

How Equity and Debt Markets Influence Project Viability
Solar project viability depends significantly on the availability and cost of capital from both equity and debt markets. Understanding how these funding sources interact with the J-curve phenomenon provides critical insights for project developers and investors navigating solar project financing.
Institutional investors, including pension funds, insurance companies, and sovereign wealth funds, have become primary capital providers for large-scale solar developments. These entities typically seek stable, long-term returns that align with their liability structures. However, their participation depends heavily on market liquidity conditions and risk-adjusted return expectations. During periods of tight liquidity, the cost of capital increases, extending the J-curve’s negative return phase as projects face higher financing expenses and delayed capital deployment.
Debt markets play an equally crucial role in determining project timelines. When credit markets tighten or interest rates rise, solar projects experience compressed returns during the initial J-curve period. Higher debt service costs reduce cash flow availability for operational improvements and expansion, potentially extending the timeline to reach positive cumulative returns. Conversely, favorable debt market conditions with low interest rates can accelerate the J-curve recovery phase by reducing financing burdens.
Market liquidity directly influences capital deployment speed. In liquid markets, developers can secure funding quickly, shortening development timelines and accelerating the transition through the J-curve’s trough. Illiquid markets create delays, increasing holding costs and extending negative return periods, which particularly affects leveraged solar projects with time-sensitive regulatory incentives or power purchase agreements.
Risk Perception and the Cost of Capital
Risk perception fundamentally shapes the cost of capital for solar photovoltaic investments, directly influencing the depth and duration of the J-curve. During periods of heightened market volatility, investors typically demand higher risk premiums to compensate for perceived uncertainties in renewable energy projects. These elevated premiums translate into increased hurdle rates—the minimum acceptable rate of return that a solar project must achieve to justify investment. For private equity firms allocating capital to solar ventures, this means that the same project economics may appear less attractive during turbulent market conditions, even when the underlying technology and revenue projections remain unchanged.
Market volatility affects investor confidence through multiple channels. Economic downturns often trigger flight-to-quality behaviors, where capital flows toward established, lower-risk investments rather than emerging solar technologies. This shift can extend the negative return phase of the J-curve, as projects struggle to secure favorable financing terms. Research collaborations between industry practitioners and universities have documented that risk premiums for solar investments can fluctuate by 200-400 basis points depending on macroeconomic conditions, substantially impacting project internal rates of return.
The relationship between perceived risk and required returns becomes particularly acute when interest rates rise. Higher baseline interest rates compress the present value of future solar generation revenues, making the initial capital-intensive phase more burdensome. Educational programs focused on financial modeling emphasize that properly accounting for risk-adjusted discount rates is essential for realistic J-curve projections. Investors must therefore evaluate whether their confidence in long-term solar performance justifies accepting deeper initial losses, recognizing that risk perception often proves more influential than actual project risk in determining capital costs.
Interest Rate Impacts on PV Project Economics
Discount Rates and Net Present Value Calculations
Net present value calculations form the mathematical foundation for understanding how discount rates influence solar project valuations and intensify the J-curve effect in private equity investments. When evaluating long-duration photovoltaic assets with operational lifespans exceeding 25 years, the discount rate applied to future cash flows becomes a critical determinant of current project value.
The NPV formula discounts each future cash flow by dividing it by (1 + r) raised to the power of the time period, where r represents the discount rate. For solar projects, this means cash flows expected in year 20 or 25 face substantial discounting when interest rates rise. A project generating $1 million annually shows dramatically different present values when calculated at 5% versus 8% discount rates—the difference compounds over decades of operation.
Rising interest rates create two compounding challenges for solar investments. First, they increase the discount rate applied to future revenue streams, reducing the present value of long-term operational cash flows that justify the initial capital outlay. Second, higher rates typically coincide with increased borrowing costs for project financing, elevating the initial negative cash position. Together, these factors deepen the J-curve’s initial trough by simultaneously lowering future value calculations while raising upfront costs.
This mathematical reality explains why solar projects become less attractive in high-rate environments despite unchanged physical performance characteristics. A project with identical energy production profiles and revenue potential may shift from economically viable to marginal based solely on discount rate adjustments. Understanding these solar investment metrics proves essential for stakeholders evaluating project feasibility across varying economic conditions, particularly when comparing investment opportunities against alternative asset classes with different duration characteristics.
Financing Costs and Debt Service
Interest rate fluctuations significantly impact solar photovoltaic project financing, particularly during the initial years when the J-curve effect is most pronounced. When projects secure debt financing, higher interest rates translate directly into increased debt service obligations, deepening the negative cash flow trough that characterizes early project phases. For solar installations, which typically carry debt-to-equity ratios between 70:30 and 80:20, even modest rate increases can substantially affect project economics.
During construction and early operational periods, solar projects face their highest debt obligations while generating minimal or zero revenue. A project financed at 5% versus 8% interest rates experiences markedly different cash flow profiles. The higher rate scenario extends the duration of negative returns and delays the inflection point where cash flows turn positive. This timing shift can discourage institutional investors seeking faster capital recovery.
Loan terms also adjust based on prevailing interest rate environments. Lenders may shorten amortization periods or require higher debt service coverage ratios when rates rise, further constraining available cash flow. Conversely, favorable rate environments enable longer-term financing structures that better align with solar asset lifecycles spanning 25-30 years.
Financial institutions collaborating with universities on renewable energy research programs have documented how interest rate sensitivity analysis helps project developers model various financing scenarios. These studies demonstrate that projects with robust revenue projections and efficient operational frameworks can better withstand rate volatility, though careful financial structuring remains essential for navigating the J-curve’s challenging early phase.
The Refinancing Window and Rate Sensitivity
Interest rate environments fundamentally influence refinancing opportunities for solar projects, directly impacting the J-curve’s depth and duration. When interest rates decline, project owners can refinance existing debt at lower costs, immediately improving cash flow and accelerating the transition from negative to positive returns. This refinancing window becomes particularly valuable for solar installations that secured initial financing during higher-rate periods, as reduced debt service obligations compress the J-curve’s trough phase.
Conversely, rising interest rates constrain refinancing options and may extend the period of negative returns. Projects financed during low-rate environments face challenges if they require additional capital or restructuring when rates increase. Solar developers must carefully time refinancing decisions, balancing immediate cost savings against market uncertainties. Rate sensitivity analysis has become essential for institutional investors evaluating solar portfolios, as even modest rate fluctuations can significantly alter projected internal rates of return and payback periods, making interest rate forecasting a critical component of private equity solar investment strategies.
Real-World Implications for Solar Project Development
Strategies to Flatten the J-Curve
Minimizing the depth and duration of the J-curve in solar photovoltaic projects requires deliberate planning and execution across multiple dimensions. Project developers and investors can employ several proven strategies to accelerate the transition from negative to positive cash flows.
Accelerated construction timelines represent a foundational approach to flattening the J-curve. By compressing engineering, procurement, and construction phases through parallel workstreams and prefabrication techniques, developers can reduce the period of capital outflow without revenue generation. This requires meticulous project management and often involves performance incentives for engineering, procurement, and construction contractors to meet aggressive deadlines without compromising quality standards.
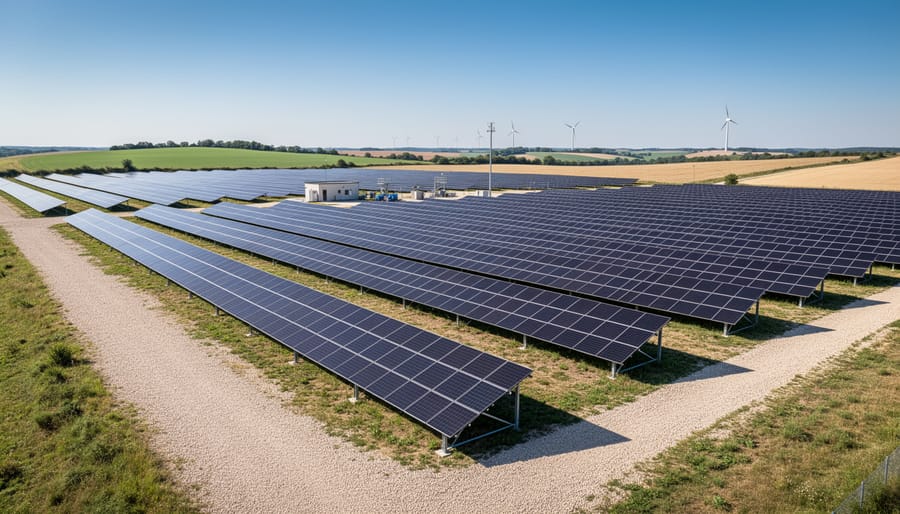
Phased development strategies allow projects to generate revenue from initial installations while subsequent phases remain under construction. This modular approach particularly benefits utility-scale solar farms, where sections can achieve commercial operation independently. Early revenue streams offset ongoing capital expenditures, creating a gentler slope in the initial J-curve descent.
Strategic offtake agreements secured during development provide revenue certainty that fundamentally reshapes cash flow projections. Power purchase agreements with creditworthy counterparties at favorable rates reduce market risk and enable strategic financing approaches with lower capital costs. These contracted revenues demonstrate project viability to lenders and equity investors, facilitating better financing terms.
Operational optimization through advanced monitoring systems and predictive maintenance protocols maximizes energy generation from day one. Performance ratio improvements of even two to three percentage points significantly impact cash flows during critical early operational years. Universities collaborating on performance analytics research have demonstrated that data-driven optimization can reduce the J-curve depth by improving revenue realization during the typically weakest cash flow periods.
These combined strategies transform the J-curve from a steep valley into a manageable transition phase.
When to Pursue Solar Projects in Different Market Conditions
Evaluating optimal timing for solar project investments requires a comprehensive framework that accounts for macroeconomic conditions and their impact on J-curve dynamics. Understanding when to deploy capital can significantly influence both the depth and duration of negative returns during the initial investment phase.
During low interest rate environments, solar projects benefit from reduced financing costs, which compresses the J-curve’s negative phase. Lower discount rates applied to future cash flows increase present values, making projects more attractive despite upfront capital requirements. These conditions typically coincide with greater capital availability, as investors seek yield-generating alternatives to traditional fixed-income securities. Project developers should prioritize expansion during these periods, as the combination of affordable debt and abundant equity capital creates favorable conditions for minimizing initial losses.
Conversely, rising interest rate cycles present strategic challenges. Higher borrowing costs extend the time required to reach positive returns, deepening the J-curve trough. However, these periods also create opportunities for well-capitalized investors. Projects initiated during high-rate environments may benefit from securing long-term power purchase agreements at elevated prices, which reflect current market conditions. Additionally, reduced competition from capital-constrained competitors can improve project economics through better equipment pricing and contractor availability.
Capital availability cycles require particular attention. During periods of market stress or economic uncertainty, even viable projects may struggle to secure financing at reasonable terms. Academic research partnerships with universities have demonstrated that comprehensive market analysis improves timing decisions, particularly when evaluating regional grid infrastructure capacity and regulatory environments.
The optimal decision framework integrates multiple factors: current and projected interest rates, utility-scale versus distributed generation opportunities, technology costs, and regulatory incentives. Educational programs emphasizing financial modeling help professionals develop skills to assess these variables systematically, ensuring strategic deployment of capital that optimizes long-term returns while managing J-curve exposure effectively.
Educational Considerations for Aspiring PV Professionals
Essential Financial Competencies
Navigating the J-curve in private equity-backed solar projects requires photovoltaic professionals to master several critical financial competencies. Financial modeling expertise stands paramount, enabling professionals to accurately forecast cash flows, project returns, and assess the depth and duration of initial negative returns characteristic of the J-curve. These models must incorporate variable factors including installation costs, energy production curves, maintenance expenses, and revenue projections across 20-30 year project lifecycles.
Capital markets knowledge is equally essential, as professionals must understand how debt and equity financing structures impact solar PV economics. This includes familiarity with tax equity structures, power purchase agreements, and how interest rate fluctuations affect project viability and investor returns. Understanding the weighted average cost of capital (WACC) and its sensitivity to market conditions allows professionals to optimize capital structures.
Economic analysis skills enable practitioners to evaluate macro-environmental factors affecting project performance, including inflation rates, currency risks, and policy changes. Many universities now collaborate with industry leaders to develop specialized training programs addressing these competencies, ensuring aspiring professionals gain practical experience in financial scenario analysis and risk assessment methodologies essential for successful project finance navigation.

Understanding the J-curve framework provides photovoltaic professionals with essential perspective for evaluating solar project economics throughout their lifecycle. This analytical lens reveals why initial negative cash flows should not discourage investment in projects with strong long-term fundamentals. By recognizing that upfront capital expenditures, development costs, and construction periods naturally create early-stage losses before revenue generation begins, stakeholders can make more informed decisions about project viability and timing.
Awareness of capital market conditions and interest rate dynamics proves equally critical for comprehensive project assessment. Rising interest rates increase discount rates applied to future cash flows, potentially extending the J-curve’s negative phase and affecting project financing costs. Conversely, favorable capital market conditions can accelerate the transition to positive returns through reduced borrowing costs and improved investor sentiment. PV professionals who integrate these financial considerations into their evaluation frameworks gain competitive advantages in structuring deals, negotiating terms, and selecting optimal development timelines.
This integrated understanding enables more sophisticated risk management and strategic planning. Academic institutions and industry organizations increasingly emphasize these financial literacy components in educational programs, recognizing that technical expertise alone proves insufficient for navigating today’s complex renewable energy landscape. By mastering J-curve dynamics alongside capital market fundamentals, emerging professionals position themselves to drive sustainable growth in the photovoltaic sector.