
Supply chain inventory optimization in photovoltaic manufacturing and distribution is a structured methodology that balances stock levels, working capital, and service commitments to reduce carrying costs while meeting customer demand during periods of technology transition and market volatility. The process delivers measurable outcomes: typical implementations reduce inventory holding costs by 15 to 30 percent, improve on-time delivery rates, and free up capital for strategic investments in next-generation technologies.
The solar industry presents unique inventory challenges that distinguish it from conventional electronics supply chains. Module efficiency improvements arrive on 18-month cycles, creating obsolescence risk for warehoused products. Polysilicon and wafer lead times can extend beyond six months, while downstream demand fluctuates with policy cycles, seasonal installation patterns, and utility procurement schedules. Optimizing inventory in this environment requires purpose-built approaches that account for rapid technology depreciation, multi-tier supplier networks spanning Asia, Europe, and North America, and the complex interplay between spot markets and long-term supply agreements.
This article provides a comprehensive framework for implementing inventory optimization across PV supply chains, from raw material procurement through module distribution. You’ll learn the foundational data requirements and organizational readiness factors necessary before launching an optimization initiative, step-by-step implementation protocols aligned with industry best practices, and governance structures that define accountability between procurement, operations, and finance teams. The guidance draws on research partnerships with leading universities specializing in renewable energy supply chain management and reflects real-world deployment experience across utility-scale developers, module manufacturers, and distribution networks.
Whether you’re managing component sourcing for a gigawatt-scale production facility or coordinating regional inventory for a commercial installer network, systematic optimization transforms inventory from a cost burden into a strategic capability that supports growth while protecting margins.
What Supply Chain Inventory Optimization Is in the PV Industry
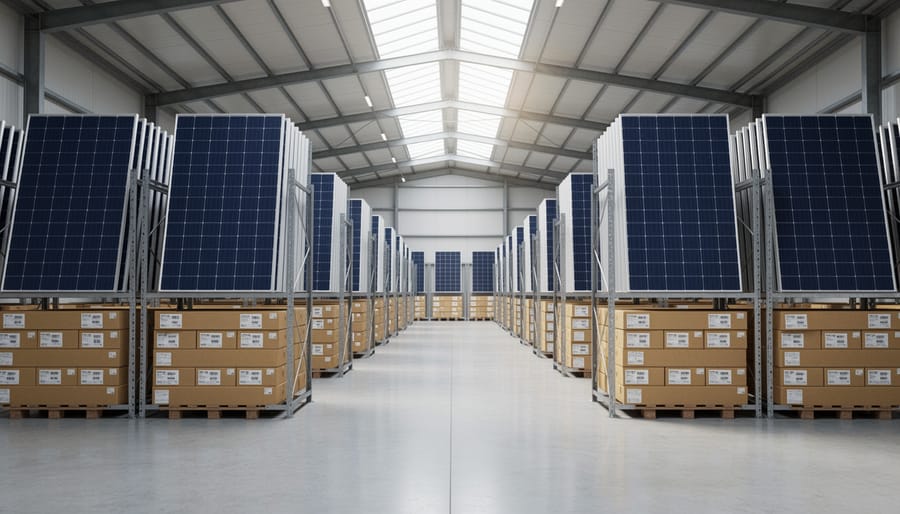
Core Components of PV Inventory Optimization

Effective PV inventory optimization rests on five interconnected components, each addressing specific supply chain challenges while contributing to overall working capital efficiency and service performance. These elements function as an integrated system within monthly S&OP cycles, where demand signals, supply constraints, and financial targets converge to inform inventory decisions.
- Demand forecasting: Translates project pipeline data, seasonal installation patterns, and technology adoption trends into SKU-level requirements across multiple time horizons
- Safety stock calculations: Determines buffer inventory levels needed to protect against demand volatility and supply disruptions while accounting for PV-specific lead time variability
- Reorder point determination: Establishes inventory thresholds that trigger replenishment orders, balancing supplier minimum order quantities against holding costs and warehouse capacity
- Multi-echelon optimization: Coordinates stock positioning across factory finished goods, regional distribution centers, and local warehouses to minimize total system inventory while maintaining service levels
- Scenario planning: Models alternative futures, technology transitions, tariff changes, incentive expiration deadlines, to test inventory strategies against plausible demand shifts
Demand forecasting in solar supply chains extends beyond traditional time-series analysis. Leading manufacturers layer statistical models with bottom-up project pipeline visibility, where specific installations with known module specifications and timing drive near-term demand. This hybrid approach addresses the challenge that single large projects can swing monthly demand by 20-30% in certain markets. Forecasters must also account for technology transitions: when a manufacturer announces a shift from PERC to TOPCon cells, it creates simultaneous demand spikes for new-generation inventory and accelerated obsolescence of legacy stock.
Safety stock calculations grow more complex in PV environments due to upstream concentration risk. When three suppliers control 70% of global polysilicon or wafer capacity, supply disruptions propagate across the industry simultaneously. Demand variability inventory planning models must incorporate both independent demand variation and correlated supply shocks, often requiring stochastic simulation rather than simple standard deviation calculations. For components with 8-12 week ocean transit times from Asia to North America or Europe, these buffers become substantial.
Multi-echelon optimization proves particularly valuable for vertically integrated players and large distributors managing inventory across manufacturing, regional hubs, and project sites. The model determines optimal stock allocation: should safety stock for a specific inverter model sit in a centralized European warehouse or be pushed forward to country-level distribution centers? The answer depends on demand correlation between markets, transportation lead times, and the cost penalty of expedited shipments when local stock runs out.
Differences Between Traditional and Solar-Specific Optimization
Traditional inventory optimization models assume relatively stable product lifecycles, predictable demand patterns, and gradual technology evolution. Solar supply chains operate under fundamentally different constraints that render these conventional approaches inadequate.
The most dramatic difference is technology obsolescence velocity. In consumer electronics or automotive parts, product generations might span three to five years. PV modules transition far more rapidly, mono PERC dominated the market in 2023, yet by late 2025 TOPCon cells captured over 60% of new manufacturing capacity. This compression means inventory purchased six months ago can lose 15-20% of its value before reaching installation, forcing solar-specific optimization models to incorporate aggressive obsolescence risk factors and shorter planning horizons than traditional manufacturing would tolerate.
Module efficiency improvements create inverse demand patterns that confound standard forecasting algorithms. As cell efficiency climbs from 22% to 24%, projects require fewer panels to achieve the same power output. A distributor stocking 400W modules suddenly faces reduced unit demand even as total project pipeline grows, a dynamic virtually unknown in traditional industries where better products typically expand market size rather than shrink unit volumes.
Regulatory incentive deadlines introduce hard demand cliffs absent from most supply chains. Investment Tax Credit step-downs, local content rules with compliance cutoffs, and state-level renewable portfolio standards create artificial demand spikes followed by steep drop-offs. Conventional inventory models using moving averages or exponential smoothing catastrophically overstock heading into these cliff edges.
Project pipeline visibility compounds these challenges. Unlike retail or industrial distribution where thousands of small orders smooth demand variability, solar depends on lumpy project completions. A single utility-scale development slipping three months can leave a regional distributor with millions in stranded inventory, while standard safety stock calculations based on demand variance would drastically underestimate this concentration risk.
Organizational Eligibility and Readiness Requirements

Technical Prerequisites and Data Requirements
Effective inventory optimization algorithms depend on robust data infrastructure and accurate system inputs. Before launching an optimization initiative, PV organizations must establish foundational technology capabilities that feed reliable information into planning models. Without these prerequisites, even sophisticated optimization software produces flawed recommendations that erode rather than build confidence in the process.
The core requirement is an enterprise resource planning (ERP) or materials requirement planning (MRP) system with clean master data. Bills of materials must accurately reflect component relationships for each product, silicon wafer quantities per cell, cells per module, EVA film specifications, because optimization models calculate material needs by exploding finished goods forecasts through these structures. Errors cascade: a 5% BOM inaccuracy multiplies across thousands of units, creating systematic over- or under-ordering. Organizations should audit BOM accuracy quarterly, targeting 98% or higher correctness for high-volume SKUs.
Historical demand data forms the foundation for forecasting algorithms. Most optimization approaches require at least 12-18 months of shipment history at the SKU level, though 24-36 months provides better pattern recognition for seasonality and trend analysis in solar markets. This data must distinguish between actual customer demand and constrained supply, recording what you could have sold, not just what inventory allowed you to ship. Capturing project pipeline information separately from spot market orders enables segmentation strategies that apply different inventory policies to different demand patterns.
Supplier performance records, actual lead times, delivery reliability, quality rejection rates, determine safety stock calculations. Organizations should track not just quoted lead times but realized performance, including variability. A supplier promising 12-week delivery but ranging from 9 to 16 weeks requires higher safety stock than one consistently delivering in 12-13 weeks. Quality metrics matter equally: if 3% of incoming silicon wafers fail inspection, procurement must order extra to ensure production schedules hold. These metrics align with KPIV and KPOV frameworks that identify input variables affecting process outcomes.
Integration capabilities enable data flows between systems. Optimization tools need real-time or near-real-time feeds from ERP transaction systems, warehouse management platforms, and demand planning applications. Manual data exports and spreadsheet reconciliation introduce delays and errors that undermine optimization responsiveness.
Organizations should verify these technical foundations before selecting optimization software:
- ERP/MRP system with 98%+ BOM accuracy for high-volume products
- Minimum 12-18 months of SKU-level demand history with constrained vs. unconstrained demand flagged
- Supplier lead time tracking showing both average and variability by commodity category
- Quality metrics capturing rejection rates and rework requirements for incoming materials
- API or ETL capabilities supporting automated data exchange with planning systems
- Data governance processes ensuring consistent definitions across functions (sales, operations, finance)
Data quality standards matter as much as data availability. Inventory optimization algorithms amplify input errors, so establishing validation rules, exception reporting, and regular data cleansing routines protects model integrity. Finance and operations teams should jointly own data accuracy metrics, tying them to performance reviews to ensure accountability extends beyond the supply chain function alone.
Process Maturity and Cross-Functional Alignment
Implementing inventory optimization without organizational readiness resembles installing sophisticated forecasting software on a laptop with no internet connection, the tool exists, but the environment can’t support it. Solar manufacturers and distributors often invest in advanced optimization algorithms only to watch them fail because the surrounding organizational structure lacks the maturity to absorb and act on their recommendations.
The foundation starts with an established Sales and Operations Planning process that meets monthly with consistent agendas, metrics, and participants. Without regular S&OP cycles where demand planners, procurement specialists, production managers, and sales leaders reconcile forecasts against capacity, inventory optimization outputs have nowhere to land. The algorithm might recommend reducing safety stock on 166mm mono PERC modules while increasing buffer inventory for TOPCon bifacial panels, but if no cross-functional forum exists to validate that recommendation against upcoming project pipelines and supplier lead time changes, planners won’t execute it.
Cross-functional governance determines whether optimization serves the business or becomes isolated in the supply chain department. Finance must participate in setting working capital targets and service level trade-offs. Sales needs to provide early visibility into utility-scale project awards that will spike inverter demand six months out. Operations must commit to production schedule stability so that WIP inventory calculations reflect reality rather than hypothetical manufacturing plans. This alignment mirrors the collaborative requirements seen in 4PL logistics eligibility assessments, where multiple stakeholders must coordinate around shared objectives.
Executive sponsorship matters because inventory optimization inevitably surfaces uncomfortable truths, perhaps the company carries three months of slow-moving racking components because sales consistently over-promises delivery speed, or maybe procurement negotiated volume discounts that created obsolescence risk during the PERC-to-TOPCon transition. A sponsor with budget authority and organizational credibility can navigate these conflicts and enforce the discipline needed to sustain the program beyond initial enthusiasm.
How to Implement the Inventory Optimization Process
Phase 1: Assessment and Baseline Establishment
The assessment phase establishes your starting point by quantifying current inventory performance and identifying specific improvement opportunities within your solar supply chain. Begin with a comprehensive current-state inventory analysis that segments stock by category: raw materials (polysilicon, glass, backsheets), cells at various efficiency grades, and finished modules differentiated by technology generation (PERC, TOPCon, heterojunction). Calculate inventory turns and days on hand for each SKU category, not just aggregated totals. Solar manufacturers typically discover significant variation, commodity materials like aluminum frames may turn 8-12 times annually while specialized junction boxes for bifacial modules sit 60-90 days.
Measure service level performance across different customer segments. Track fill rates, on-time delivery percentages, and backorder frequency for utility-scale project developers versus residential distributors. Determine whether service failures stem from demand forecast errors, supplier delivery issues, or internal allocation decisions. Many PV operations find their service levels vary wildly by product line, with legacy PERC modules achieving 95% fill rates while newer TOPCon variants struggle at 78%.
Conduct a cost-to-serve analysis that captures total inventory carrying costs (warehousing, financing, insurance, obsolescence), expediting expenses, and margin impacts from stockouts. Calculate these costs by product family and customer segment to reveal where optimization delivers maximum value.
Document PV-specific inventory challenges during this diagnostic. Quantify generation-over-generation transition waste, the inventory write-downs when module efficiency improvements (say, 450W to 480W upgrades) obsolete existing stock faster than sales deplete it. Map project-specific buffer stocks maintained for large utility contracts with locked-in delivery windows. Identify slow-moving inventory accumulated from overly optimistic demand forecasts during market downturns.
This baseline assessment provides the factual foundation for setting realistic optimization targets and prioritizing which inventory categories and locations will deliver the quickest return on improvement efforts.
Phase 2: Model Design and Parameter Configuration

Once your baseline is clear, choose an optimization methodology that matches your supply chain’s complexity and data availability. Deterministic models work for stable product lines with predictable demand patterns, think established mono PERC panels sold to repeat utility customers. They calculate optimal order quantities and reorder points using fixed assumptions about lead times and demand rates. Stochastic models, by contrast, account for variability and uncertainty through probability distributions, making them essential for emerging product categories like TOPCon or heterojunction modules where demand is still maturing and forecast error is high. Most PV operations benefit from a hybrid approach: deterministic logic for mature products, stochastic models for new technologies and project-driven demand.
Demand forecasting algorithms must reflect different product behaviors. Mature panel lines can use time-series methods (exponential smoothing, ARIMA) that capture seasonal installation peaks and historical trends. New technologies require judgmental forecasting blended with market adoption curves, since historical sales data is sparse or nonexistent. For project-specific components, custom mounting hardware, specialty inverters, forecasting ties directly to project pipeline visibility rather than aggregate demand patterns. Configure your models to refresh forecasts monthly as part of your S&OP cycle, and weight recent actuals more heavily in fast-changing segments.
Safety stock calculations depend on your chosen service level targets, which should vary by customer segment. Tier-one utility customers with long-term offtake agreements may warrant 98-99% fill rates, justifying higher safety buffers. Spot market sales can operate at 90-95% service with leaner inventory. Calculate safety stock using the standard formula, safety factor times demand variability times lead time variability, but adjust lead time assumptions for PV realities: silicon wafer deliveries often extend 12-16 weeks, while domestic glass sourcing may optimize replenishment lead times to 4-6 weeks. Input actual supplier performance data rather than contracted lead times, since delays are common in constrained markets.
Set reorder points that trigger procurement early enough to replenish stock before safety buffers deplete. For multi-echelon supply chains, raw materials to cells to modules to regional distribution centers, configure the model to optimize inventory placement across all tiers simultaneously, avoiding the bullwhip effect where each stage over-buffers independently.
Phase 3: Technology Selection and Integration
Selecting the right technology platform for inventory optimization in PV operations requires evaluating both software capabilities and integration complexity. Organizations face a fundamental choice between standalone optimization tools, specialized solutions like Blue Yonder, o9 Solutions, or Kinaxis, and optimization modules embedded within existing ERP systems such as SAP IBP or Oracle Cloud SCM. Standalone tools typically offer more sophisticated algorithms for multi-echelon optimization and scenario modeling, particularly valuable for complex solar supply chains with long lead times and volatile demand. ERP-embedded solutions provide tighter integration with transactional systems but may lack advanced features like stochastic modeling or constraint-based planning.
The integration architecture must support continuous, bidirectional data flows across your planning ecosystem. Demand forecasts need to flow from planning tools to optimization engines, which then generate recommended reorder points and safety stock levels that feed into procurement and MRP systems. Actual inventory levels, supplier performance, and consumption data must flow back to continuously refine optimization parameters. For PV manufacturers managing multiple product generations simultaneously, legacy mono PERC panels alongside newer TOPCon modules, this requires clean SKU master data and accurate bills of materials that link components to finished goods across technology transitions.
Prioritize solutions offering API-based integration rather than batch file transfers. Real-time visibility becomes critical when project developers suddenly accelerate installation timelines or tariff changes trigger buying surges. Your warehouse management system should automatically update available-to-promise quantities as optimization algorithms adjust safety stocks, while procurement platforms receive revised order recommendations within the same S&OP cycle. Testing these integrations thoroughly during the pilot phase prevents data sync failures that undermine optimization accuracy during full deployment.
Phase 4: Pilot Implementation and Validation
A controlled pilot tests your optimization model in a limited scope before committing the entire supply chain to algorithmic recommendations. Select 15-20 representative SKUs spanning different product categories, mono PERC modules for mature demand patterns, TOPCon panels for emerging technologies, and common balance-of-system components like inverters or racking. Choose one or two distribution centers or manufacturing locations where supply planners can closely monitor daily execution and quickly identify model anomalies.
Run the pilot for at least two full demand cycles in solar, ideally covering both peak installation season (typically Q2, Q3 in most markets) and the slower winter months. This seasonal span reveals whether safety stock parameters hold during surge demand and whether the model correctly releases inventory during lulls without creating obsolescence risk. Track actual fill rates against target service levels, measure inventory turns weekly, and document every instance where planners override system recommendations, these overrides expose gaps in model logic or missing business rules.
Compare pilot SKU performance against a control group managed through legacy methods. Calculate the difference in inventory days on hand, stockout frequency, and expediting costs. In one pilot, a Tier 1 module manufacturer reduced safety stock 22% on mature products while improving on-time delivery from 94% to 97%, but discovered the model underestimated buffer needs for newly launched bifacial panels during their first production ramp.
Validate that upstream procurement signals align with the model’s replenishment recommendations and that your processes avoid customs delays that could invalidate lead time assumptions. Refine demand forecast inputs, adjust safety stock multipliers for high-variability products, and tune reorder triggers before scaling the program across all SKUs and locations.
Phase 5: Full Deployment and Change Management
Once pilot validation confirms the optimization model performs reliably, deployment expands to the entire product portfolio and all stocking locations. This phase requires careful sequencing, most organizations roll out by product family or geographic region rather than attempting a simultaneous launch, which reduces risk and allows teams to absorb new workflows progressively.
Comprehensive training becomes critical at this stage. Planners and buyers must understand not just how to use the optimization software, but why the model recommends specific reorder points and safety stock levels. Training should cover interpreting confidence intervals in demand forecasts, recognizing when to override system suggestions (such as during known technology transitions from PERC to TOPCon), and documenting the business rationale for manual adjustments. Hands-on workshops using real SKU data prove more effective than generic software training.
Governance structures formalize decision rights and escalation paths. Monthly review meetings assess optimization performance against targets, address recurring system overrides, and refine parameters as market conditions shift. Exception-handling procedures define thresholds that trigger human review, for example, when the system recommends reducing safety stock for a component experiencing supplier quality issues, or increasing inventory ahead of anticipated tariff changes.
Integrating optimization outputs into existing S&OP cycles ensures recommendations inform monthly supply reviews and executive decision-making. The demand consensus from S&OP feeds the optimization engine, which returns recommended inventory positions that finance reviews for working capital implications. This closed-loop process prevents optimization from operating in isolation and ensures alignment with broader business objectives across the solar supply chain.
Rights, Responsibilities, and Performance Obligations

Stakeholder Roles and Decision Authority
Successful inventory optimization in PV supply chains requires clear assignment of roles and decision-making authority across multiple functions. Without defined accountability, even the most sophisticated optimization models generate recommendations that sit ignored or spark endless debates over who can act.
Demand planners own forecast accuracy for all product categories, from mainstream mono PERC modules to emerging TOPCon and heterojunction technologies. They collect input from sales, incorporate market intelligence on project pipelines and incentive deadlines, and produce the statistical forecasts that drive all downstream inventory calculations. Their authority extends to adjusting baseline forecasts based on known project awards, but they cannot unilaterally change service level targets or safety stock policies, those decisions require cross-functional agreement.
Supply planners execute replenishment based on optimization model outputs, placing orders when inventory reaches calculated reorder points and managing inbound materials to warehouse capacity constraints. They have discretion to expedite orders when forecast spikes occur or delay receipts when demand softens, but significant deviations from planned inventory levels require finance approval due to working capital implications.
Procurement teams maintain supplier relationships and ensure contracted lead times and quality standards are met. They’re responsible for supplier scorecards tracking on-time delivery, defect rates, and compliance with standards including forced labor enforcement requirements. When supplier performance degrades, procurement must either resolve issues or recommend lead time buffer adjustments to the optimization model.
| Role | Primary Responsibilities | Key Decisions | Accountability Metrics |
|---|---|---|---|
| Demand Planners | Forecast generation, market intelligence integration | Baseline forecast adjustments, promotion planning | Forecast accuracy (MAPE), bias |
| Supply Planners | Replenishment execution, inventory positioning | Order timing, expedite/delay calls | Fill rates, inventory turns, stockout incidents |
| Procurement | Supplier management, lead time reliability | Supplier selection, contract terms | On-time delivery %, quality PPM, compliance audit results |
| Finance | Working capital management, cost analysis | Inventory budget allocation, obsolescence reserves | Days inventory outstanding, carrying costs, write-offs |
| Executive Leadership | Strategic direction, resource allocation | Service vs. cost trade-offs, policy overrides | Total supply chain cost, customer satisfaction, cash flow |
Finance controls working capital targets and approves inventory investments beyond planned levels. During technology transitions, say, from PERC to TOPCon, finance decides how much obsolete stock to liquidate versus hold for service parts, balancing write-off costs against customer commitments.
Executive leadership reserves authority for major trade-off decisions: accepting higher costs to guarantee module supply for critical projects, or tightening inventory to preserve cash during market downturns. They can override optimization recommendations when business circumstances change dramatically, but such overrides trigger formal documentation and review at the next S&OP cycle to prevent ad hoc decision-making from becoming standard practice.
Performance Measurement and Continuous Improvement
Measuring the performance of your inventory optimization program requires a balanced scorecard that tracks both inventory efficiency and customer service outcomes. Solar supply chains face unique measurement challenges due to rapid technology transitions and project-driven demand patterns, making it essential to track metrics at multiple levels of granularity rather than relying on company-wide averages alone.
Essential KPIs for a PV inventory optimization program include:
- Inventory turns by product category: 4-6 turns annually for mature module technologies, 8-12 turns for commodity components like junction boxes and cables, 2-3 turns for emerging technologies with uncertain demand
- Fill rate achievement: 95-98% for standard modules to project developers, 99%+ for critical balance-of-system components needed to avoid installation delays
- Forecast accuracy: Mean Absolute Percentage Error (MAPE) below 20% at the product family level for three-month horizons, recognizing that individual SKU accuracy will be lower
- Obsolescence rate: Less than 2% of total inventory value written off annually due to technology transitions or expiration of manufacturer warranties
- Working capital efficiency: Days inventory outstanding targets of 60-75 days for finished goods, 30-45 days for raw materials, with clear visibility to cash conversion cycles
- Safety stock optimization: Actual stock levels within 10% of calculated optimal levels, with documented justifications for any exceptions
Conduct monthly performance reviews as part of your regular S&OP cycle, comparing actual results against targets and investigating significant variances. These reviews should identify patterns such as consistent forecast bias for specific product lines or regional markets, systematic supplier delivery issues affecting safety stock consumption, or changes in demand volatility that require parameter adjustments. Assign clear ownership for each metric to ensure accountability and rapid response to deteriorating performance.
Quarterly optimization model recalibration is critical in solar supply chains where market conditions shift rapidly. This deeper review examines the validity of underlying assumptions: Are lead time estimates still accurate as your supplier base evolves? Have customer service level expectations changed with new contract terms? Do demand patterns reflect the transition from older to newer module technologies? Update demand forecasting algorithms, safety stock formulas, and reorder point calculations based on the most recent 12-18 months of data, and test model recommendations against business judgment before implementing changes. This disciplined cadence prevents models from becoming stale while avoiding constant parameter changes that create planning instability.
Where to Get Expert Help and Educational Resources
Professional Consulting and Implementation Partners
Selecting the right implementation partner accelerates time-to-value and reduces execution risk in PV inventory optimization initiatives. Three categories of partners serve distinct needs in solar supply chain transformations.
Specialized supply chain consultancies bring methodology expertise and industry benchmarking. Firms with renewable energy practices understand PV-specific challenges like technology transition management and project-based demand patterns. They typically provide strategy development (defining optimization scope and business case), model design (configuring forecasting algorithms and safety stock parameters), and organizational change management. Expect 12-16 week engagements for mid-sized manufacturers, with deliverables including current-state assessments, future-state designs, and pilot implementation support.
Software vendors offering professional services combine platform deployment with technical configuration. Leading inventory optimization and advanced planning systems require deep customization for PV applications, mapping complex bill-of-material structures, configuring multi-echelon logic for regional warehouses, integrating with ERP systems. Vendor implementation teams handle software installation, data migration, user training, and go-live support. These engagements typically span 16-24 weeks and include ongoing technical support contracts.
Hybrid partnersfirms combining consulting expertise with technology implementation, offer end-to-end capability but may have preferred platform relationships that limit software neutrality.
When evaluating partners, prioritize demonstrated PV supply chain experience over generic credentials. Request case studies showing module manufacturer or distributor implementations, not just generic renewables references. Verify they understand solar-specific metrics like generation-over-generation transition waste and project pipeline visibility. Ask how they handle forecast accuracy for emerging technologies versus mature products. The right partner should challenge your assumptions, not simply configure software to replicate existing processes.
Educational Programs and Certification Pathways
Building expertise in inventory optimization requires structured education combined with solar-specific knowledge. Several certification pathways and training programs equip supply chain professionals with the analytical skills, process frameworks, and industry context needed to implement effective optimization in PV operations.
The Association for Supply Chain Management (ASCM) offers two foundational certifications relevant to PV inventory optimization. The Certified in Production and Inventory Management (CPIM) program covers demand management, procurement, material requirements planning, capacity management, and master scheduling, core competencies directly applicable to balancing stock levels across silicon wafers, cells, and finished modules. The Certified Supply Chain Professional (CSCP) credential takes a broader view, addressing end-to-end supply chain design, planning, execution, and improvement methodologies that help professionals understand how inventory decisions fit within overall supply chain strategy. Both programs provide the quantitative methods and process discipline essential for configuring optimization models and interpreting their recommendations.
While general supply chain certifications establish fundamental competencies, solar-specific training addresses the unique dynamics of PV supply chains: rapid technology transitions that create obsolescence risk, seasonal demand patterns driven by incentive deadlines and weather-dependent installations, and long lead times for specialized components like high-efficiency cells.
This type of industry-focused education bridges the gap between generic supply chain theory and the practical realities of managing inventory across module generations, navigating polysilicon price volatility, and optimizing stock levels during technology inflection points like the shift from mono PERC to TOPCon architectures. Aspiring PV supply chain professionals benefit from combining standardized certifications with solar-specific coursework that addresses real-world scenarios they’ll encounter in module manufacturing facilities, component distribution centers, and project development operations.
Industry Associations and Knowledge Networks
Industry associations and knowledge networks offer collaborative environments where PV supply chain professionals can access benchmarking data, share implementation experiences, and learn from peers facing similar inventory optimization challenges. These organizations bridge the gap between theoretical best practices and real-world solar industry applications.
The SEMI PV Group serves as a primary forum for photovoltaic manufacturers and their suppliers, hosting supply chain working groups that address inventory management in the context of rapid technology transitions and equipment standardization. Members gain access to quarterly supply chain surveys providing anonymized benchmarking data on inventory turns, lead times, and working capital metrics across different segments of the solar value chain. Their annual conferences feature dedicated tracks on operational excellence where companies present case studies on optimization implementations.
Solar Energy Industries Association (SEIA) maintains supply chain working groups focused on addressing common challenges in the U.S. solar market, including inventory positioning strategies for project-driven demand patterns and managing stock during policy transition periods. These forums facilitate discussions on handling domestic content requirements, tariff impacts on stocking decisions, and coordinating inventory across fragmented distribution networks.
Council of Supply Chain Management Professionals (CSCMP) offers renewable energy forums within its broader supply chain community, connecting solar professionals with inventory optimization practitioners from other industries. This cross-pollination proves valuable for adapting proven methodologies from automotive or electronics sectors to PV-specific contexts. Their research initiatives and whitepapers frequently address multi-echelon optimization and demand sensing techniques applicable to solar supply chains.
Participating in these networks provides ongoing access to evolving best practices as the industry matures, helping organizations avoid common implementation pitfalls and accelerate their optimization journeys through collective learning.
Common Implementation Challenges and Solutions
PV inventory optimization initiatives frequently stall due to four interconnected challenges that, while predictable, require sustained attention and industry-specific solutions to resolve.
Data quality issues present the most immediate obstacle. Many solar manufacturers and distributors discover that their ERP systems contain incomplete or inconsistent records for lead times, demand history, and cost data, particularly when they have grown through acquisition or operate across multiple regions. Missing or inaccurate bills of materials for new module generations compound the problem, as do gaps in returned goods data from installers. The solution starts with a focused data cleansing effort before model deployment: prioritize the top 20% of SKUs by revenue, establish data stewardship roles with accountability for each critical data element, and implement validation rules that flag anomalies at the point of entry rather than during monthly reporting cycles.
Organizational resistance emerges when planners and buyers perceive optimization tools as threats to their expertise. Sales teams worry that lower inventory targets will compromise project fulfillment, while finance celebrates working capital reduction without understanding service-level trade-offs. Effective change management addresses this through early involvement: include frontline planners in model design, create transparent review processes where human judgment can override recommendations with documented rationale, and share early wins that demonstrate how optimization frees planners from routine calculations to focus on exception management and supplier relationships.
Model accuracy problems in solar contexts stem from treating PV products like stable commodities. Standard forecasting algorithms struggle with technology transitions, demand for PERC modules collapses faster than historical patterns suggest when TOPCon or heterojunction alternatives reach price parity. Project-based demand creates lumpy order patterns that confuse statistical models expecting smooth consumption. Solutions include segmenting products by lifecycle stage with different forecasting approaches for mature versus emerging technologies, incorporating external signals like utility procurement schedules and ITC deadline effects, and running scenario-based optimization that plans for multiple demand futures rather than a single forecast.
Integration challenges arise when optimization tools cannot seamlessly exchange data with procurement, warehouse management, and financial systems. Manual data exports and re-keying introduce errors and delay decisions. The practical path forward involves prioritizing integration touchpoints by business impact, automated replenishment order creation delivers faster returns than perfect data visualization, and leveraging standard APIs rather than custom integrations that require ongoing maintenance as systems evolve.
How do we handle technology transitions in optimization models?
Segment products by lifecycle stage and apply different forecasting methods to each: time-series algorithms for mature technologies, analogous product modeling for new launches, and phase-out curves for obsolescing generations. Run parallel demand scenarios that assume different transition speeds.
What if our ERP data is incomplete?
Start with a subset of high-value products where data quality is acceptable, implement data governance roles with accountability for each critical field, and establish validation rules that catch errors at entry rather than in monthly reviews. Clean as you go rather than delaying implementation until everything is perfect.
How do we optimize inventory when project demand is lumpy?
Use project pipeline visibility to distinguish between committed orders with known delivery dates and forecasted opportunities. Optimize replenishment inventory for base demand separately from project-specific buffers, and adjust safety stock calculations to reflect order-size variability rather than time-period volatility.
How do we balance optimization with supplier minimum order quantities?
Configure your model to respect MOQ constraints when generating recommendations, negotiate MOQ flexibility with strategic suppliers based on annual volume commitments, and consider vendor-managed inventory arrangements where suppliers hold buffer stock at their facilities or regional distribution centers.
The organizations that successfully navigate these challenges treat implementation as a learning journey rather than a one-time system deployment. They run quarterly model tuning sessions where planners review recommendation accuracy and adjust parameters based on recent performance, establish feedback loops that capture why recommendations were overridden, and share lessons learned across product categories and regions. This continuous improvement mindset proves essential in an industry where the underlying supply chain dynamics shift as quickly as solar technology itself evolves.
How to Apply or Complete the Process
Implementing supply chain inventory optimization in a PV organization doesn’t follow a formal application process with regulatory approval steps. Instead, it’s an internal business initiative requiring executive authorization and cross-functional commitment.
Start by securing executive sponsorship through a business case that quantifies the expected working capital reduction, service level improvement, and implementation costs. Present this to your CFO and COO for budget approval, typically during annual planning cycles or strategic reviews.
Once approved, establish a steering committee with representatives from supply chain, finance, sales, and operations. This group reviews progress monthly and resolves conflicts between competing objectives, like balancing inventory reductions against fill rate targets.
Formalize the initiative through written charters that define roles, decision rights, and performance metrics. Document standard operating procedures for how planners will use optimization outputs, who can override system recommendations, and escalation paths for exceptions.
Ensure compliance with existing financial controls by integrating inventory optimization recommendations into your monthly S&OP cycle and quarterly business reviews. This embeds the process into established governance rather than creating parallel decision-making structures.
No external certification or regulatory filing is required unless your organization operates under specific industry standards that mandate documented inventory management procedures.
Successful inventory optimization in photovoltaic supply chains demands more than sophisticated algorithms and forecasting models. It requires sustained organizational discipline, cross-functional alignment, and continuous adaptation to industry dynamics. Organizations that treat optimization as a one-time project rather than an ongoing capability consistently underperform those that embed it into their sales and operations planning cycles.
The integration between inventory optimization and broader S&OP processes creates the foundation for sustainable working capital efficiency and service level performance. Monthly demand reviews, quarterly model recalibration, and executive trade-off decisions form the governance structure that keeps optimization relevant as market conditions shift. Without this discipline, even the most advanced systems produce recommendations that drift out of sync with business realities.
The solar industry’s rapid evolution, technology transitions from PERC to TOPCon, shifting module efficiency standards, and changing regulatory incentives, makes continuous learning essential for supply chain professionals. Building expertise in both technical optimization methodologies and the unique characteristics of PV supply chains positions professionals to navigate these challenges effectively.
Mose Solar’s educational program, developed in collaboration with leading universities, provides aspiring professionals with the specific knowledge needed for solar supply chain planning and inventory management. As the industry scales toward 2026 deployment targets, investing in education and capability building will differentiate organizations that thrive from those that struggle with excess inventory and capital constraints.