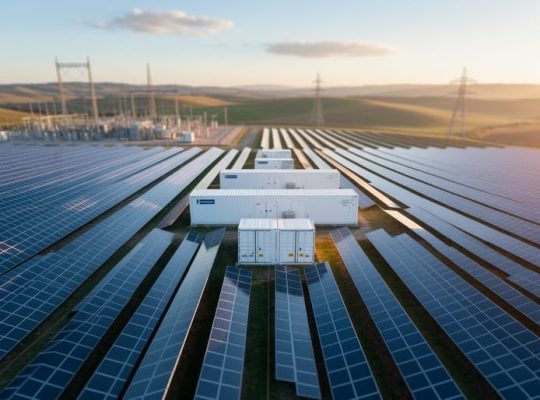
A climate source is a repository of historical and real-time meteorological data used to model solar irradiance, temperature, and atmospheric conditions for photovoltaic system performance predictions. In solar industrial process heat analytics, the choice of climate source directly determines the accuracy of energy yield forecasts, equipment sizing decisions, and financial modeling for multi-megawatt installations where even small forecasting errors translate into millions of dollars in lost revenue or oversized infrastructure.
The quality and resolution of climate data have become critical differentiators in professional solar design since 2020, when industry standards began requiring site-specific validation rather than regional averages. For engineers designing solar thermal systems that must maintain precise process temperatures in manufacturing environments, selecting the appropriate climate source means the difference between a system that meets production demands and one that forces expensive backup heating. The relationship between climate data accuracy and system carbon footprint optimization has become equally important, as undersized systems fail to displace fossil fuel consumption while oversized installations carry unnecessary embodied emissions.
This article examines how climate sources function within solar analytics platforms, the taxonomy of available data types from satellite-derived datasets to ground-based measurements, and the practical selection criteria that PV professionals use when matching data sources to project requirements. Through collaboration with university research programs and feedback from our educational offerings in renewable energy modeling, we’ve identified the specific climate source characteristics that correlate with successful industrial installations. Understanding these data foundations enables more confident project proposals, tighter performance guarantees, and systems that deliver predicted output across their 25-year operational lifespan.
What a Climate Source Means for Solar Energy Systems
A climate source is a systematically curated dataset or repository that contains historical meteorological measurements and derived variables essential for modeling solar energy system performance. Unlike weather forecasts that predict short-term atmospheric conditions for the next hours or days, climate sources provide validated long-term records spanning years or decades. These datasets capture critical parameters including solar irradiance components, ambient temperature, wind speed and direction, relative humidity, and atmospheric pressure.
For solar industrial process heat applications, climate sources serve as the empirical foundation for performance analytics. Engineers and analysts use these datasets to simulate how a proposed or existing solar thermal system will behave under real-world climate conditions over its operational lifetime. The distinction between climate data and weather forecasts matters because investment decisions and system design for industrial installations require confidence in long-term energy delivery, not just tomorrow’s sunshine.
Climate sources contain several specialized measurements that define the solar resource and environmental conditions at a location:
- Climate Source
- A curated repository of validated historical meteorological data used for long-term solar energy modeling and performance prediction.
- TMY (Typical Meteorological Year)
- A synthetic dataset compiled from multi-year weather records, representing statistically typical conditions for energy modeling purposes.
- GHI (Global Horizontal Irradiance)
- The total solar radiation received on a horizontal surface, combining direct sunlight and diffuse sky radiation, measured in watts per square meter.
- DNI (Direct Normal Irradiance)
- Solar radiation arriving directly from the sun’s disk, measured perpendicular to the sun’s rays, critical for concentrating solar technologies.
- DHI (Diffuse Horizontal Irradiance)
- Scattered solar radiation from the sky and clouds, excluding direct sunlight, measured on a horizontal surface.
- Ambient Temperature
- The air temperature at a location, which affects solar collector efficiency, thermal losses, and system performance in industrial process heat applications.
The value of climate sources lies in their quality control, spatial coverage, and temporal granularity. Reputable datasets undergo validation against ground measurements, gap-filling for missing periods, and standardization into formats compatible with industry-standard simulation tools. This processing transforms raw observations into reliable inputs for calculating annual energy yields, sizing thermal storage systems, and projecting financial returns over 20 to 25-year project lifespans.
How Climate Sources Work in Process Heat Analytics
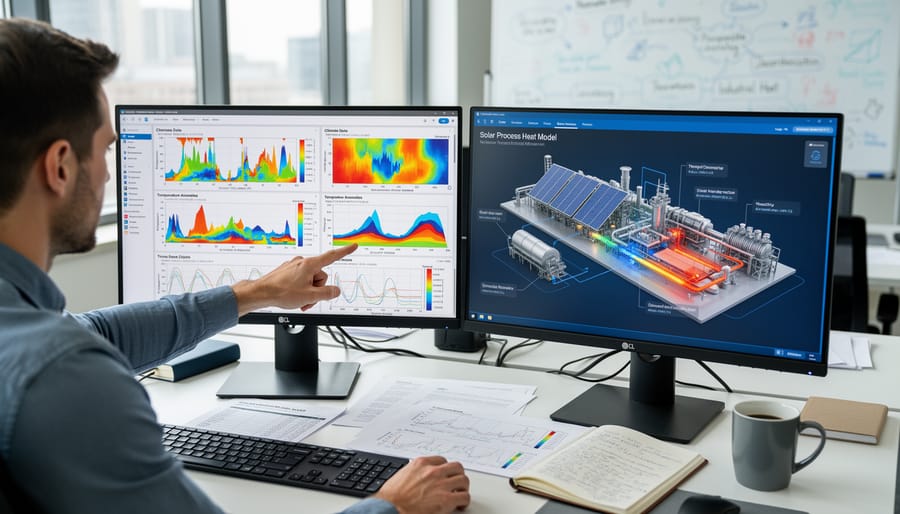
Data Collection Methods
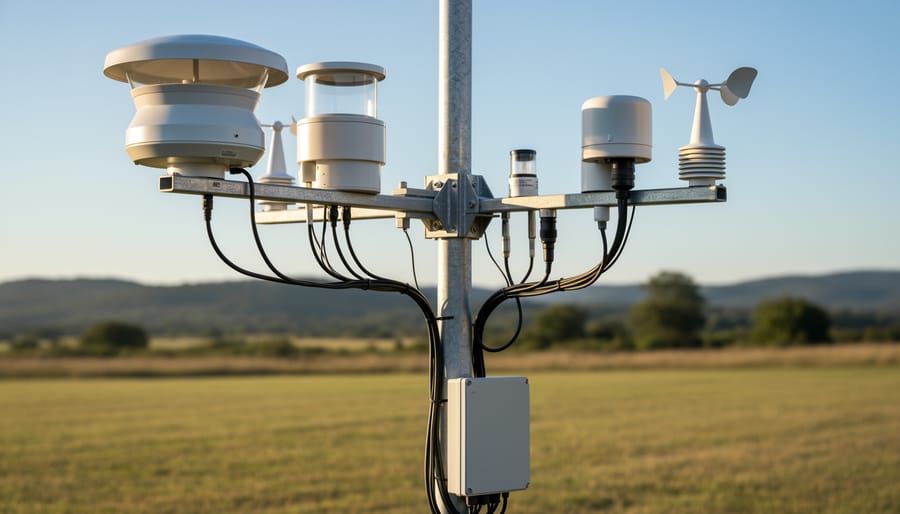
The foundation of any climate source begins with direct measurement of atmospheric conditions and solar radiation. Three primary collection methods supply the raw data that feeds into climate databases used for solar process heat analytics.
Satellite-based measurements provide the broadest geographic coverage. Geostationary and polar-orbiting satellites equipped with radiometers capture reflected and emitted radiation from Earth’s surface and atmosphere. These instruments measure cloud cover, aerosol concentrations, and surface albedo at intervals ranging from 15 minutes to several hours. While satellites excel at covering remote regions where ground infrastructure doesn’t exist, their spatial resolution typically ranges from 1 to 10 kilometers, meaning measurements represent averaged conditions across large areas rather than precise point locations.
Ground-based pyranometers offer superior accuracy for specific sites. These dome-covered sensors directly measure solar irradiance striking a horizontal surface, recording data at one-minute or sub-minute intervals. Networks of research-grade pyranometers, such as those operated under the Baseline Surface Radiation Network, maintain calibration standards traceable to international references. The trade-off: pyranometers only capture conditions at their exact installation point, leaving gaps between stations.
Meteorological stations complement radiation measurements by recording temperature, humidity, wind speed, and atmospheric pressure. These variables influence solar system performance and help validate satellite-derived estimates. Station density varies dramatically by region, with developed areas maintaining networks spaced every 50 to 100 kilometers while developing regions may have stations hundreds of kilometers apart.
The resolution characteristics of each method determine which climate source best suits particular modeling requirements.
From Raw Data to Usable Climate Models
Raw meteorological observations rarely arrive in a state ready for solar energy modeling. Ground stations may experience sensor downtime, satellite passes miss cloud-obscured regions, and data transmission glitches create temporal gaps. Transforming this fragmented input into reliable climate models requires a multi-stage pipeline that professional solar thermal analysts depend on daily.
Quality control comes first. Automated algorithms flag physically impossible values, negative irradiance readings, temperatures exceeding sensor limits, while statistical tests identify suspicious outliers against historical norms. Human reviewers examine flagged records, distinguishing genuine anomalies from measurement errors.
Gap-filling addresses missing intervals through interpolation techniques that preserve temporal patterns. Short gaps (under six hours) typically use linear or spline interpolation between adjacent valid readings. Longer gaps demand more sophisticated approaches: regression models correlate missing parameters with nearby stations, while machine learning methods like random forests predict values based on satellite estimates and atmospheric conditions.
Standardization converts disparate formats into consistent structures. Temperature readings migrate from local units to kelvin, irradiance values align to watts per square meter at standard conditions, and timestamps normalize to UTC with clear timezone documentation. Metadata tagging specifies measurement height, sensor type, calibration dates, and uncertainty ranges, details critical when comparing datasets or validating simulation results.
The final product emerges as hourly or sub-hourly timeseries spanning years or decades, formatted for direct ingestion by solar modeling platforms that calculate industrial process heat system performance across representative climate conditions.
Categories of Climate Data Sources
Satellite-Derived Climate Databases
Satellite-derived climate databases offer PV professionals the advantage of global coverage and consistent methodologies, making them invaluable for preliminary solar resource assessment across diverse geographies. These datasets leverage geostationary and polar-orbiting satellite observations to estimate solar irradiance components, temperature, and other meteorological variables at ground level through physics-based radiative transfer models.
The NSRDB satellite-derived radiation data covers North America and select international regions with half-hourly temporal resolution, providing direct normal irradiance (DNI), global horizontal irradiance (GHI), and diffuse horizontal irradiance (DHI) estimates essential for solar thermal process heat modeling. PVGIS (Photovoltaic Geographical Information System) serves European and African markets with free-access solar radiation data suitable for initial feasibility screening. Solargis delivers commercial-grade satellite datasets with enhanced spatial resolution and validation against ground measurements, often preferred for bankable performance assessments.
These platforms increasingly integrate interactive climate models that allow engineers to visualize multi-year solar resource variability and assess climate uncertainty impacts on industrial installations. While satellite data sacrifices some accuracy compared to ground stations, its spatial completeness and historical depth (typically 15-30 years) make it the practical starting point for most solar industrial process heat projects.
Ground-Measured Meteorological Records
Ground-measured meteorological records represent the gold standard for climate data accuracy in solar process heat analytics. These datasets come from physical instruments, pyranometers, thermocouples, anemometers, installed at specific locations, providing direct measurements rather than satellite-derived estimates or model outputs.
The Baseline Surface Radiation Network (BSRN) operates over 60 high-precision stations worldwide, delivering research-grade solar irradiance measurements with uncertainties below 2%. BSRN data undergoes rigorous quality control and calibration protocols, making it invaluable for validating satellite products and calibrating simulation models. However, station density remains sparse, limiting coverage for specific industrial sites.
National meteorological services maintain broader networks of weather stations that record solar radiation, temperature, wind speed, and humidity at hourly or sub-hourly intervals. Organizations like NOAA, MeteoSwiss, and the Australian Bureau of Meteorology provide accessible archives spanning decades. While these stations may not match BSRN precision, their geographic coverage and long temporal records make them essential for establishing local climate baselines.
For solar industrial process heat projects near existing measurement stations, ground-based records offer unmatched confidence in resource assessment and performance predictions.
Typical Meteorological Year (TMY) Datasets
Typical Meteorological Year (TMY) datasets occupy a unique position among climate sources. Unlike satellite databases that deliver actual historical measurements or reanalysis products that reconstruct specific past conditions, TMY files are synthetic: they assemble a composite year from selected months of real weather data chosen to represent typical long-term conditions at a location.
The construction methodology matters. TMY3, the current U.S. standard developed by NREL, draws from 30 years of hourly observations, selecting individual months that best match the long-term statistical profile for that period. TMY represents long-term conditions by blending January from one year, February from another, and so forth, producing a single 8,760-hour file that captures average solar resource behavior without extreme events.
For solar industrial process heat planning, this approach offers a practical advantage: one standardized year of hourly data suitable for sizing systems and estimating baseline performance. TMY datasets smooth out anomalies, making them ideal for feasibility studies and comparative site assessments where you need representative conditions, not worst-case or peak scenarios.
The trade-off is immediacy. TMY3 files, based on 1991-2005 observations, don’t reflect climate shifts occurring since then. For 2026 projects requiring current climate trends, pairing TMY with updated satellite or reanalysis sources provides a more complete picture.
Reanalysis Climate Products
Reanalysis products combine historical observations with advanced numerical weather models to produce spatially complete, physically consistent climate datasets spanning decades. Unlike satellite-derived or ground-measured sources that may have gaps or limited coverage, reanalysis fills in missing data through atmospheric physics simulations constrained by available observations.
ERA5, produced by the European Centre for Medium-Range Weather Forecasts, provides hourly climate data from 1940 onwards at approximately 31 km spatial resolution globally. Its comprehensive atmospheric modeling makes it valuable for locations lacking ground measurements, though solar irradiance estimates typically show lower accuracy than dedicated satellite products for specific sites.
MERRA-2 (Modern-Era Retrospective analysis for Research and Applications, Version 2) from NASA offers similar global coverage with particular strengths in aerosol representation affecting solar radiation. It extends from 1980 to near-present with spatial resolution around 50 km.
For industrial process heat analytics, reanalysis datasets excel in gap-filling for preliminary assessments and providing long-term climate trend context. However, their coarser spatial resolution and model-based solar irradiance estimates mean they should be validated against local measurements or higher-resolution satellite products before finalizing system designs. They remain essential tools for understanding regional climate variability and historical weather patterns influencing solar thermal performance.
Applications in Solar Industrial Process Heat

Site Selection and Feasibility Studies
Climate data sources serve as the primary decision-making tool when evaluating potential locations for industrial solar process heat installations. During feasibility studies, engineers analyze multi-year solar irradiance records to determine whether a site receives sufficient direct normal irradiance (DNI) for concentrating solar thermal collectors or adequate global horizontal irradiance (GHI) for flat-plate systems. A manufacturing facility in southern Spain with annual DNI exceeding 2,200 kWh/m² presents fundamentally different opportunities than a similar plant in northern Germany averaging 1,000 kWh/m².
Temperature patterns extracted from climate sources equally influence system design and economic viability. Ambient temperature affects both thermal collector efficiency and the temperature lift required to reach process heat specifications. Sites with cooler ambient conditions demand more energy input to achieve target temperatures, directly impacting system sizing and levelized cost calculations.
Climate sources also reveal seasonal variability that determines thermal storage requirements and backup heating capacity. A location with consistent year-round irradiance enables smaller storage systems and higher solar fractions than sites experiencing pronounced seasonal swings. This granular climate intelligence transforms preliminary site rankings into quantified feasibility assessments, allowing project developers to prioritize locations offering optimal resource-to-demand alignment before committing capital to detailed engineering studies.
Performance Prediction and Financial Modeling
Multi-year climate datasets form the backbone of credible performance and financial projections for solar industrial process heat systems. Engineers feed historical climate records, typically 10 to 30 years of hourly solar irradiance, ambient temperature, and wind data, into simulation tools like System Advisor Model (SAM) or TRNSYS to generate annual energy delivery estimates. These simulations account for how real-world weather variability affects collector efficiency, thermal losses, and auxiliary heating requirements across seasons.
From these energy projections, financial analysts calculate the levelized cost of heat, which divides the total lifecycle cost of the solar system by its cumulative useful thermal energy output. LCOH becomes the key metric for comparing solar process heat against conventional boilers or natural gas. Climate source quality directly impacts LCOH accuracy: a dataset with poor spatial resolution or incomplete cloud cover data can overestimate solar yield by 15% or more, leading to flawed investment decisions.
Beyond LCOH, multi-year climate records enable sensitivity analysis and risk assessment. Developers model performance under P50, P75, and P90 exceedance probabilities, representing median, conservative, and pessimistic scenarios, to quantify revenue uncertainty for lenders and equity investors. This probabilistic approach, impossible without robust historical climate data, underpins bankable feasibility studies for industrial solar thermal projects in 2026.
Operational Planning and System Optimization
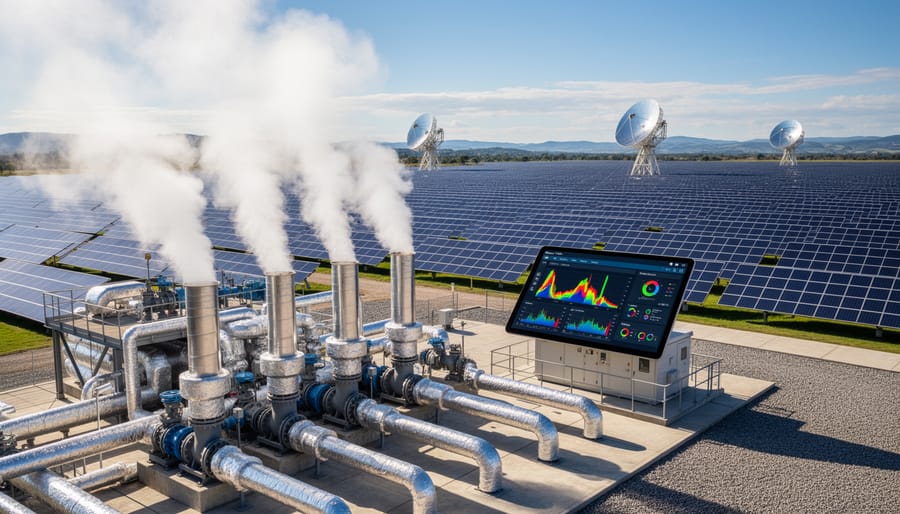
Operational climate data transforms how industrial facilities size and run solar process heat installations year-round. By analyzing multi-year diurnal temperature swings and seasonal irradiance curves, engineers can right-size collector arrays to match actual demand profiles rather than over- or under-building based on assumptions. A chemical plant requiring consistent 120°C heat might discover that summer climate patterns allow 70% solar fraction with modest storage, while winter months need backup capacity, data that prevents costly oversizing.
Thermal storage dimensioning relies heavily on climate source analysis. Hourly insolation data reveals how many consecutive low-radiation days occur in each season, directly informing tank capacity requirements. A facility in a region with stable morning fog patterns might shift production schedules to afternoon hours when irradiance peaks, reducing storage needs by 30-40%.
Integration with existing boiler systems becomes more efficient when climate analytics identify optimal control strategies. Solar-plus-storage configurations tuned to local weather patterns can preheat feedwater during high-radiation windows, cutting fossil fuel consumption during predictable low-demand periods. Climate data even guides maintenance scheduling around historically cloudy months, maximizing uptime when solar contribution matters most.
Selecting the Right Climate Source for Your Project
Choosing a climate dataset isn’t a one-size-fits-all decision. The right source depends on where your project sits in the development pipeline, the precision your financial models demand, and how much you can allocate for data acquisition. Early-stage feasibility studies often work well with free, satellite-derived datasets like PVGIS or NASA POWER, which provide reasonable regional estimates without upfront cost. These sources offer broad geographic coverage and sufficient accuracy to screen potential sites or compare macro-level solar resource quality across regions. However, as you move into detailed engineering design or bankable performance modeling for a solar industrial process heat installation, you’ll need higher-resolution data, ideally validated ground measurements or commercial satellite products like Solargis or Meteonorm that offer sub-kilometer spatial resolution and hourly or sub-hourly temporal granularity.
Geographic location matters significantly. In well-monitored regions like Central Europe or parts of North America, you can access high-quality meteorological station records or detailed TMY datasets. In less-instrumented areas, satellite-derived sources become essential, but verify their uncertainty estimates and validation history against nearby ground stations if available. For projects exposed to climate change risk or long-term performance guarantees, consider reanalysis datasets like ERA5 that provide consistent historical coverage extending decades back, enabling you to assess inter-annual variability and long-term trends rather than relying on a single typical year.
Budget constraints force trade-offs. Free datasets may lack the hourly resolution needed for accurate thermal storage sizing or peak demand matching in industrial applications. Commercial sources cost anywhere from a few hundred to several thousand dollars per site, but they typically include quality assurance documentation, validation reports, and technical support, critical when presenting performance projections to financiers or industrial clients. Ensure your chosen dataset integrates smoothly with your simulation platform, whether that’s PVsyst, System Advisor Model, or a custom analytics environment. Mismatched file formats or missing variables create unnecessary friction and can introduce errors during import. When in doubt, pilot two datasets in parallel on a small test case to compare outputs before committing to one source for your full project.
Common Questions About Climate Sources in Solar Analytics
How accurate are climate data sources, and can they truly represent the conditions my solar process heat system will experience? This question tops the list of concerns from aspiring PV professionals entering the industrial solar thermal sector. Understanding the strengths and limitations of climate datasets is essential for setting realistic performance expectations and avoiding costly miscalculations.
How accurate are satellite-derived climate sources compared to ground measurements?
Satellite climate sources typically achieve 5-15% accuracy for solar irradiance in most regions, with lower accuracy in complex terrain or areas with frequent cloud cover. Ground-measured data from calibrated pyranometers remains the gold standard, often within 2-3% accuracy, but satellite datasets offer superior spatial coverage for initial site screening and regional assessment.
What’s the difference between TMY datasets and actual year climate data?
Typical Meteorological Year (TMY) datasets represent synthesized “average” conditions compiled from multiple years of observations, designed for long-term performance modeling and financial projections. Actual year data reflects real historical conditions for a specific period, useful for validating operational performance or studying system behavior during particular weather events.
How often should I update the climate datasets for my project?
For feasibility and design phases, climate data from the most recent 10-20 year period provides sufficient accuracy. Operational projects benefit from quarterly or annual updates to incorporate recent observations, particularly in regions experiencing rapid climate shifts or when assessing year-over-year performance variations.
Are free climate sources adequate for commercial solar process heat projects?
Free datasets like PVGIS or NSRDB work well for preliminary screening and academic research, but commercial projects typically warrant premium sources offering higher resolution, better uncertainty quantification, and validated accuracy. The incremental cost of quality climate data is negligible compared to the financial risk of performance shortfalls in multi-million dollar industrial installations.
Beyond these common queries, professionals often ask whether climate change projections should factor into system design for installations with 20-30 year operational lifetimes. While most current climate sources focus on historical observations, emerging datasets now incorporate future climate scenarios. For industrial process heat applications where PV environmental impact and long-term decarbonization goals drive investment decisions, considering climate trends can inform conservative sizing and storage capacity planning.
Another frequent question centers on spatial resolution requirements. Industrial sites often have localized microclimates affected by surrounding structures, dust sources, or terrain features. While 1-5 kilometer resolution satellite data suits regional assessment, site-specific validation using at least six months of on-site measurements improves accuracy for final system sizing. This dual approach balances cost-effectiveness with the precision needed to guarantee thermal output commitments.
The uncertainty quantification capabilities of climate sources deserve attention too. Premium datasets now provide confidence intervals and bias-correction metadata, allowing engineers to model performance ranges rather than single-point estimates. This probabilistic approach aligns with modern risk assessment frameworks and helps secure financing for industrial solar thermal projects by demonstrating thorough due diligence to stakeholders and lenders.
Climate sources form the bedrock of credible solar industrial process heat analytics. Without accurate, representative meteorological data, even the most sophisticated modeling tools produce unreliable predictions that can derail project feasibility, misguide capital allocation, and undermine the economic case for solar thermal integration. The quality of your climate input directly determines the reliability of your performance forecasts, financial projections, and operational planning.
Selecting the right climate dataset is not a one-size-fits-all decision. Site feasibility studies demand broad geographic coverage with sufficient spatial resolution to identify optimal locations. Detailed engineering design requires high-temporal-resolution data that captures diurnal and seasonal variations affecting thermal storage sizing. Financial modeling needs multi-decade records to establish realistic performance expectations and quantify uncertainty. Each project phase has distinct data requirements, and matching the climate source to those needs separates rigorous analytics from guesswork.
The field continues to advance. Satellite imaging improves in resolution and accuracy. Ground measurement networks expand coverage in previously underserved regions. Machine learning techniques enhance gap-filling and bias correction. New reanalysis products blend observations with improved atmospheric models. These developments make climate data more accessible and reliable for industrial solar applications in 2026 and beyond.
For aspiring photovoltaic professionals seeking to master climate data evaluation and application, Mose Solar collaborates with universities to provide educational programs that bridge theoretical meteorology with practical solar energy system design. Understanding how to critically assess climate sources, interpret uncertainty ranges, and apply appropriate datasets to real-world industrial heating challenges remains an essential competency. As solar process heat installations scale globally, the professionals who command climate analytics will lead the transition toward decarbonized industrial energy systems.