Commodity price risk hedging in photovoltaic procurement typically costs between 1.5% and 4% of the total commodity value being protected, though exact expenses depend on contract duration, the specific raw material, market volatility at the time of execution, and whether companies manage hedges internally or engage specialized brokers. A solar manufacturer hedging $10 million in polysilicon purchases might spend $150,000 to $400,000 annually in combined premiums, transaction fees, and administrative costs.
The primary cost drivers separate sharply by commodity type. Polysilicon and silver, both critical to cell production and subject to supply concentration risks, command higher hedging premiums than aluminum or steel used in racking systems. Market volatility amplifies costs further: during periods of price instability like the 2021-2023 polysilicon shortage, option premiums doubled or tripled compared to stable periods. Contract tenor matters significantly as well. A six-month forward contract protecting against near-term price spikes costs less in absolute terms than a three-year hedge, though longer instruments provide more comprehensive protection for multi-year project pipelines.
Procurement professionals face a strategic choice between managing hedges in-house or partnering with commodity brokers and financial institutions. Internal management requires dedicated treasury expertise and direct exchange access but eliminates broker commissions, typically 0.3% to 0.8% of notional value. External specialists provide market intelligence and execute complex strategies like collar options or dynamic hedging programs, valuable for organizations without deep commodity finance teams.
Understanding these cost structures empowers solar companies to make informed risk management decisions rather than absorbing raw material volatility directly into project margins. For procurement managers balancing budget constraints against supply chain stability, the framework that follows clarifies when hedging costs justify the protection and which instruments match specific risk profiles.
Hedging Costs by Commodity Type
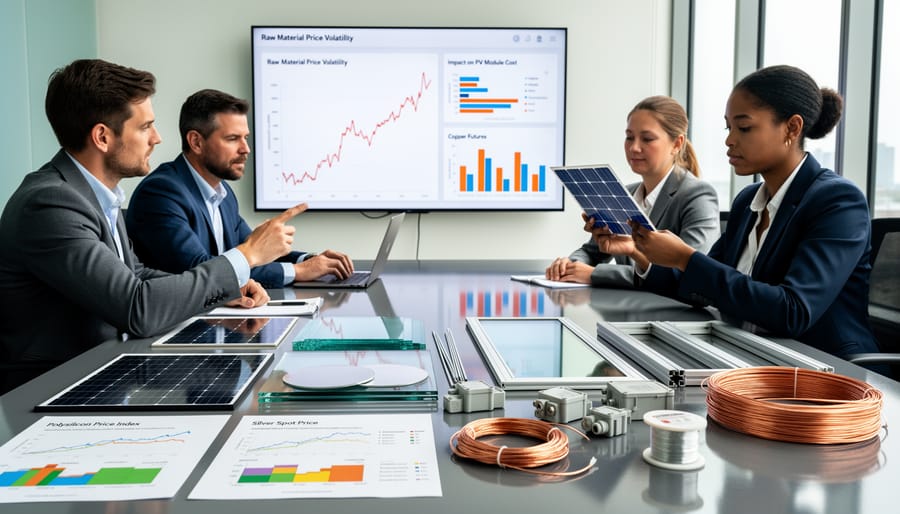
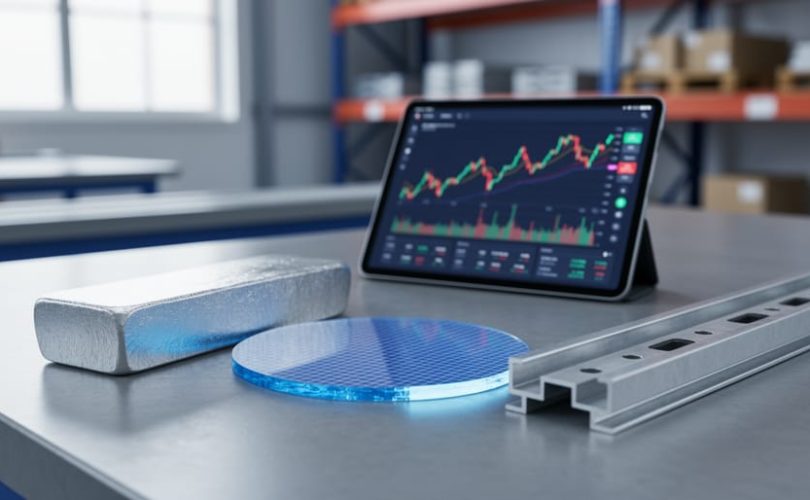
Hedging costs in PV procurement vary substantially by commodity type, reflecting differences in market liquidity, price volatility, and contract standardization. Understanding these cost ranges helps procurement teams allocate risk management budgets and prioritize which materials warrant hedging protection.
Polysilicon represents the highest-value hedging target for most PV manufacturers. Hedging costs typically run 2-4% of contract value for six-month protection, with minimum contract sizes around $500,000. The polysilicon market experiences significant price swings, often 30-50% annually, driven by capacity additions, demand cycles, and energy policy shifts in major producing regions. This volatility makes hedging more expensive but also more critical for margin protection.
Silver paste, the second most volatile input cost, carries hedging expenses of 3-5% of contract value. Unlike polysilicon, silver benefits from highly liquid global metals markets with standardized futures contracts. However, PV manufacturers typically consume silver in smaller quantities, leading to minimum hedges around $250,000-$400,000. The precious metal’s dual role as both industrial input and investment vehicle creates price movements that can exceed 40% year-over-year.
| Commodity | Hedging Cost (% of Contract) | Minimum Contract | Annual Volatility |
|---|---|---|---|
| Polysilicon | 2-4% | $500,000 | 30-50% |
| Silver Paste | 3-5% | $250,000 | 35-45% |
| Aluminum Frames | 1.5-2.5% | $200,000 | 20-30% |
| Copper | 1.5-3% | $150,000 | 25-35% |
| Steel | 1-2% | $100,000 | 15-25% |
Aluminum frames cost less to hedge, typically 1.5-2.5% of contract value, thanks to deep commodity markets and lower relative volatility compared to specialty materials. Minimum positions start around $200,000, making aluminum hedging accessible even for mid-sized module manufacturers. Price movements generally stay within a 20-30% annual range, though trade disputes and energy costs in smelting regions can create sharp spikes.
Copper hedging for PV applications (primarily in cables and junction boxes) runs 1.5-3% of contract value with minimums near $150,000. The London Metal Exchange provides excellent liquidity for copper contracts, keeping hedging costs moderate despite 25-35% annual volatility driven by construction cycles and electrical grid buildouts worldwide.
Steel for mounting structures and tracker systems carries the lowest hedging costs at 1-2% of contract value, reflecting both lower volatility and highly standardized futures markets. Minimum hedges start around $100,000, and price swings typically remain within 15-25% annually unless major supply disruptions occur.
These baseline costs assume standard six-month hedge durations. Longer-term protection increases costs by roughly 0.5-1% per additional six months, while shorter three-month hedges may reduce costs by 20-30% but leave procurement teams exposed to rolling and timing risks.
Commodity Hedging Cost Structure Breakdown
Broker and Exchange Fees
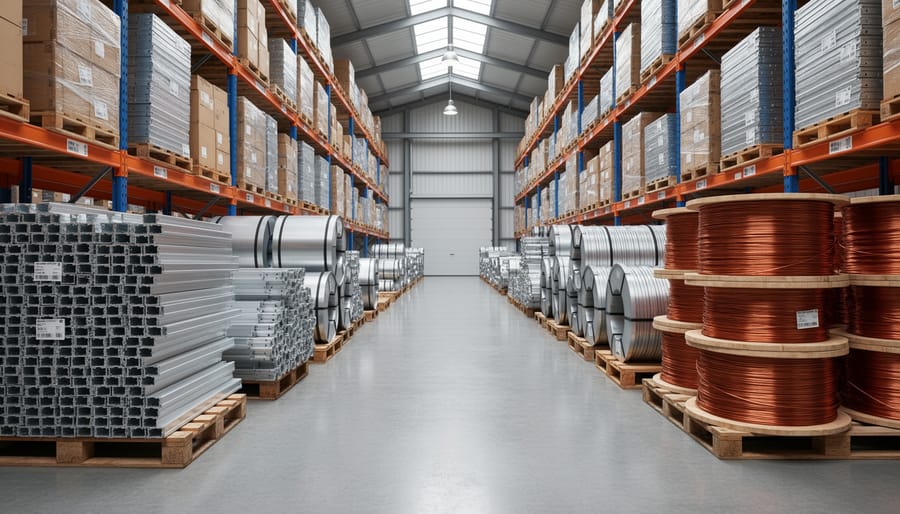
Commodity brokers typically charge between 0.03% and 0.15% of the contract value as commission for executing hedging transactions on PV materials. For a $1 million polysilicon futures contract, this translates to $300-$1,500 per trade. Volume matters significantly, manufacturers hedging $10 million or more annually often negotiate rates toward the lower end, while smaller operations pay premium commissions.
Exchange fees add another layer. The London Metal Exchange (LME) charges approximately $1.50-$3.00 per lot for aluminum and copper contracts, while specialized metals exchanges may charge $5-$15 per contract depending on the commodity. Clearing fees through clearinghouses range from $0.50 to $2.00 per contract side, protecting both parties from default risk.
These fees compound with trading frequency. A manufacturer rolling quarterly hedges will pay these costs four times annually, versus once for a single annual hedge. Monthly data subscriptions for real-time commodity pricing typically cost $500-$2,000, essential for timing entries and exits effectively.
The total fee burden for an active hedging program generally runs 0.2-0.5% of the hedged portfolio value annually when combining all broker, exchange, and clearing expenses.
Option Premiums and Derivatives Pricing
Option premiums represent the direct cost of purchasing price insurance through derivatives contracts. For PV procurement teams, put options (protecting against price increases) on polysilicon futures typically cost 2-4% of the notional contract value for six-month coverage under normal market conditions. Call options (protecting suppliers against price drops) run slightly cheaper at 1.5-3%. These percentages can triple during high-volatility periods.
Forward contracts, agreements to buy commodities at predetermined prices, don’t require upfront premiums but carry opportunity costs. If you lock polysilicon at $8/kg and spot prices drop to $6.50/kg, you’ve effectively paid a $1.50/kg penalty. Swap agreements, where companies exchange fixed prices for floating market prices, involve annual fees of 0.3-0.8% of contract value paid to the arranging bank.
Time value dramatically affects option pricing. A three-month put option on silver might cost 2.1% of contract value, while a twelve-month option costs 4.8%, not linear because longer timeframes contain more uncertainty. The mathematical relationship isn’t proportional: doubling the duration typically increases premium costs by 60-80%, not 100%.
Implied volatility is the largest premium driver. During the 2022 polysilicon supply crisis, six-month put option premiums spiked from 3% to 11% as implied volatility jumped. Procurement teams monitoring the VIX-equivalent for commodity markets can anticipate when hedging costs will surge and adjust their protection strategies accordingly.
Margin Requirements and Collateral Costs
Trading commodity futures to hedge PV raw material costs carries upfront capital requirements that function like a security deposit on every open position. PV procurement teams must post initial margin, typically 5-15% of the total contract value, to their clearing broker when establishing a futures hedge. For a $1 million polysilicon contract, initial margin might range from $50,000 to $150,000 depending on current volatility levels and exchange-set futures margin requirements. This capital gets held in a margin account for the life of the hedge, which could span six months to two years for PV procurement cycles.
Maintenance margin adds another layer. If your futures position moves against you, say polysilicon prices drop when you’re hedging upward, the broker issues a margin call demanding additional funds to restore the account to minimum levels. These variation margin payments can arrive daily during volatile periods, creating cash flow challenges for smaller manufacturers operating on tight working capital.
The opportunity cost compounds the direct expense. Capital locked in margin accounts can’t fund production expansion, R&D initiatives, or earn returns elsewhere in the business. For a mid-sized module manufacturer hedging $10 million in aluminum and copper annually, $800,000 to $1.5 million might sit idle in margin accounts, capital that could otherwise generate 8-12% returns through business operations.
Some procurement teams access credit facilities specifically for margin funding, paying 6-10% annually in facility fees and interest charges, which effectively increases total hedging costs by another 0.5-1% of contract value.
Primary Factors That Influence Hedging Costs

Market Volatility and Timing
Commodity price volatility stands as the single largest driver of hedging costs for PV procurement teams. When polysilicon prices swing 40-60% within a quarter, as occurred during supply disruptions in 2024-2025, option premiums can triple compared to stable market periods. Volatility metrics similar to the VIX in equity markets measure this price uncertainty, and higher volatility translates directly into expensive insurance: a put option protecting against polysilicon price drops might cost 2-3% of contract value in calm markets but surge to 8-12% during turbulent periods.
Market timing critically affects hedging economics. Procurement professionals who hedge during March-May, ahead of the traditional summer installation surge in the Northern Hemisphere, often face elevated premiums as demand peaks. Conversely, hedging during October-December can yield 15-30% lower costs as manufacturing activity slows. This seasonal pattern interacts with inventory optimization strategies, companies maintaining larger buffer stocks can wait for favorable hedging windows, while just-in-time operations must accept prevailing market prices.
Understanding these dynamics improves PPV calculation accuracy, as volatility-driven hedging costs directly impact total procurement variance.
Hedge Duration and Rolling Costs
Short-term hedges covering three to six months typically cost 0.8-1.5% of the notional contract value, while one to three-year hedges run 2-4%. The premium difference reflects increased time value and uncertainty over longer periods. For a $10 million polysilicon procurement, a six-month hedge might cost $100,000-$150,000, versus $200,000-$400,000 for a three-year position.
Rolling costs add substantial expenses when extending protection beyond the initial hedge period. Each time you roll a futures contract forward, you pay new transaction fees (typically $5-$15 per contract) plus potential contango or backwardation losses. A procurement team rolling quarterly positions over three years incurs twelve separate roll transactions, accumulating $60,000-$180,000 in additional costs for a mid-sized hedging program.
Basis risk management becomes more expensive with longer durations. The difference between your specific procurement contract and the standardized futures instrument widens over time, requiring additional hedging adjustments or accepting greater tracking error. Companies managing multi-year hedge portfolios often spend 0.3-0.7% annually on basis risk monitoring and adjustments, a hidden cost that compounds alongside margin requirements and opportunity costs of locked capital. Procurement teams must also factor in coordination expenses to avoid customs delays that could disrupt hedge timing and expose the company to unplanned price movements.
Company Credit Profile and Counterparty Risk
A company’s credit profile fundamentally determines both access to hedging instruments and their cost structure. Investment-grade manufacturers (BBB- or higher) typically face initial margin requirements of 5-10% of contract value, while non-rated or speculative-grade firms may post 15-25% margins, substantially increasing the capital tied up in hedging positions.
Credit rating directly impacts counterparty willingness and pricing. Major commodity brokers and banks offer preferential swap rates to highly-rated firms, often 25-50 basis points tighter than rates for lower-rated counterparts. A tier-one integrated PV manufacturer might secure aluminum futures at benchmark plus 0.3%, while a startup module producer pays benchmark plus 0.8% for identical coverage.
Smaller manufacturers without established credit facilities face additional hurdles. Many resort to cash-secured hedges, eliminating leverage benefits entirely, or pay premiums of 1.5-3% annually for credit enhancement through third-party guarantees. Counterparty banks assess default risk continuously; a credit downgrade mid-contract can trigger margin calls requiring immediate capital infusions. For procurement teams at emerging PV companies, building relationships with specialized commodity finance providers, rather than relying solely on traditional banks, often unlocks better terms despite limited credit history.
In-House Hedging vs. Professional Hedging Services
Building Internal Hedging Capabilities
Building an internal commodity hedging desk requires substantial upfront investment but can deliver cost savings for large-scale PV manufacturers. The initial staffing expense typically ranges from $150,000 to $300,000 annually per dedicated risk manager or commodity trader with relevant metals and materials experience. Most mid-sized manufacturers need at least two specialists to provide coverage and cross-verification of positions.
Trading infrastructure represents another significant capital outlay. Direct market access platforms for commodity exchanges cost $5,000 to $25,000 per month depending on functionality and connectivity requirements. Risk management software systems that track positions across multiple commodities, calculate value-at-risk, and generate compliance reports require $50,000 to $200,000 in licensing and implementation fees, plus ongoing maintenance costs of 15-20% annually.
Data subscriptions form the operational backbone of informed hedging decisions. Real-time commodity pricing feeds, market analytics, and research from providers like Bloomberg, Refinitiv, or specialized metals intelligence services run $30,000 to $100,000 per year. These systems must integrate with enterprise resource planning platforms to align procurement forecasts with hedging positions.
Compliance infrastructure adds further expense. Legal review of trading documentation, internal control frameworks, and regulatory reporting systems typically require $75,000 to $150,000 in setup costs and $25,000 to $50,000 annually thereafter.
This approach becomes economically viable for manufacturers procuring $50 million or more in commodities annually, where hedging effectiveness can offset infrastructure costs within the first year. Smaller operations with complex supply chains, particularly those navigating local content rules across multiple markets, may still justify internal capabilities if commodity exposure represents a significant margin risk.
Third-Party Risk Management Services
Third-party risk management services charge fees that typically range from 0.5% to 2% of the total hedged value, with the percentage often decreasing as contract sizes grow. A manufacturer hedging $10 million worth of polysilicon might pay $50,000 to $200,000 annually for comprehensive risk management support, while larger operations hedging $100 million could negotiate rates closer to the lower end of that spectrum.
Fee structures vary by service model. Some firms charge flat retainers ($3,000 to $15,000 monthly) plus performance fees tied to risk reduction outcomes. Others use purely transaction-based pricing, taking 0.3% to 1.5% per executed hedge. Full-service providers bundling strategy development, execution, reporting, and compliance support command premium fees compared to execution-only brokers.
For procurement teams lacking internal expertise, these services eliminate the substantial startup costs of building in-house capabilities. The $50,000 annual fee for a mid-tier service becomes cost-effective when compared to hiring a qualified commodity risk manager (typically $120,000 to $180,000 salary) plus infrastructure expenses.
Platforms developed in collaboration with universities and research institutions offer particular value for aspiring PV professionals and smaller manufacturers. These programs combine practical hedging tools with educational components, training procurement staff on commodity market fundamentals while executing hedges. The educational dimension helps teams develop internal knowledge over time, potentially reducing long-term dependence on external services.
Such collaborative platforms typically include market analysis dashboards, scenario modeling tools, and documented decision frameworks that transform hedging from a black box into a transparent, understandable process for organizations building procurement sophistication.
Hedging Strategy Selection and Cost Implications
Natural Hedging and Pass-Through Mechanisms
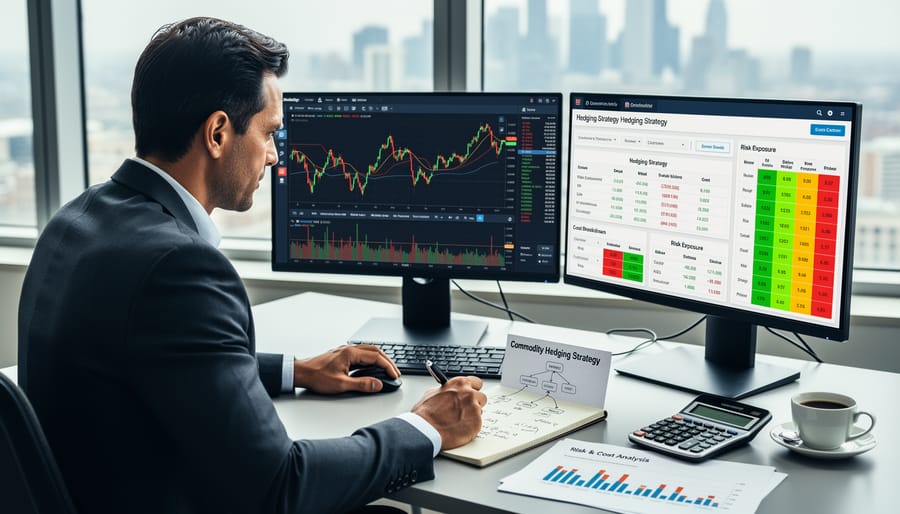
Natural hedging represents the most cost-effective commodity risk management approach for PV manufacturers and developers, eliminating or significantly reducing the need for paid derivatives instruments. This strategy leverages operational and contractual structures rather than financial products to offset commodity price exposure.
The cornerstone of natural hedging is vertical integration or strategic supply chain positioning. Manufacturers who produce their own polysilicon or maintain equity stakes in upstream commodity suppliers create inherent price alignment, raw material costs rise alongside the value of their commodity holdings. This self-balancing mechanism requires no broker fees, margin requirements, or option premiums.
Long-term supply agreements with commodity indexing provide another zero-cost hedging alternative. Rather than locking fixed prices, these contracts tie polysilicon, silver, or aluminum procurement costs to published commodity indices or production cost formulas that correlate with market prices. The procurement team accepts gradual price adjustments while eliminating sudden spike exposure.
Pass-through mechanisms in power purchase agreements shift commodity risk to offtakers. Solar developers can negotiate PPA pricing structures with quarterly adjustments tied to polysilicon or module price indices, effectively transferring price volatility to electricity buyers in exchange for marginally lower base rates.
However, natural hedging has critical limitations. Not all counterparties accept indexed pricing or pass-through clauses, particularly in competitive procurement environments. Integration requires substantial capital investment, and geographic basis risk persists when local spot prices diverge from index benchmarks. Most PV procurement teams combine natural hedging where feasible with targeted derivatives coverage for residual exposures exceeding their risk tolerance thresholds.
Derivatives-Based Hedging Strategies
Futures contracts represent the most cost-transparent hedging approach, typically incurring exchange fees of $2-8 per contract plus broker commissions of 0.15-0.4% of contract value. For polysilicon, aluminum, and copper with active futures markets, these standardized contracts work well for large-volume buyers (500+ MT quarterly) but require margin deposits of 5-15% of position value.
Forward contracts eliminate exchange fees entirely but introduce counterparty risk and credit assessment costs. Banks and commodity traders charge 0.2-0.8% of notional value for customized forwards, making them attractive for mid-sized procurement teams hedging $5-20M annually who need contract terms aligned precisely with delivery schedules rather than standardized futures expiration dates.
Swaps allow PV manufacturers to exchange floating commodity prices for fixed rates, with dealer spreads typically running 1-2.5% of notional value over the contract term. These work best for ongoing procurement where predictable budgeting outweighs the higher upfront cost, common among module manufacturers with consistent polysilicon consumption exceeding 1,000 MT annually.
Options provide downside protection while preserving upside potential, but premiums range from 3-12% of underlying value depending on strike price and duration. A six-month at-the-money put option on polysilicon might cost 5-7% of contract value during normal volatility periods.
Collar strategies combine purchased puts with sold calls, reducing net premium costs to 1-3% of contract value by capping upside gains. This balanced approach suits project developers with fixed PPA prices who need cost certainty without paying full option premiums.
Real-World Cost Examples for PV Procurement
To illustrate how hedging costs translate into real-world PV procurement operations, consider three distinct scenarios representing different operational scales in 2026. These examples demonstrate how procurement volume, commodity mix, and strategy selection directly determine hedging expenses.
A small module assembler procuring $8 million annually in polysilicon, aluminum frames, and silver paste faces relatively high hedging costs as a percentage of procurement value. With limited volume and bargaining power, they typically rely on third-party risk management services or collar strategies on polysilicon only. Their annual hedging cost ranges from $80,000 to $160,000, representing 1.0-2.0% of total procurement spending. At this scale, many companies choose selective hedging, protecting against extreme price spikes on their largest input (polysilicon) while accepting more volatility on secondary materials.
Mid-size manufacturers procuring $75 million in materials annually have sufficient volume to justify more comprehensive hedging programs. These operations typically hedge polysilicon, silver, and aluminum through a combination of futures contracts and option strategies, sometimes building basic in-house capabilities with one dedicated risk manager. Annual hedging costs fall to $450,000-$900,000, or 0.6-1.2% of procurement value, benefiting from economies of scale and access to better broker fee structures.
Large integrated producers with $500 million+ in annual commodity exposure run sophisticated hedging operations with multiple full-time traders, proprietary analytics, and diversified strategies across all major inputs. Their percentage costs drop to 0.3-0.6% of procurement value, though absolute expenditures reach $1.5-3 million annually. These firms hedge not just price risk but also basis risk between spot markets and their specific supply agreements, requiring complex swap and forward arrangements.
| Operational Scale | Annual Procurement | Hedging Strategy | Annual Hedging Cost | Cost % of Procurement |
|---|---|---|---|---|
| Small Module Assembler | $8M | Polysilicon collar + third-party service | $80,000-$160,000 | 1.0-2.0% |
| Mid-Size Manufacturer | $75M | Futures + options on polysilicon, silver, aluminum | $450,000-$900,000 | 0.6-1.2% |
| Large Integrated Producer | $500M+ | Full derivatives suite, in-house trading desk | $1.5M-$3M | 0.3-0.6% |
The percentage decline with scale reflects not just volume discounts but also the ability to internalize functions that smaller operators must outsource. A developer building a 200MW solar farm with $40 million in panel procurement might spend $300,000-$600,000 on hedging polysilicon and aluminum exposure through their EPC contractor’s hedging program, effectively paying 0.75-1.5% for price certainty that protects their PPA economics. These examples demonstrate that while absolute hedging costs rise with procurement volume, the efficiency gains make hedging more accessible and cost-effective for larger operations.
Frequently Asked Questions About PV Commodity Hedging Costs
What’s the minimum investment needed to start hedging PV commodity price risk?
The practical minimum for derivatives-based hedging typically starts around $500,000 in annual commodity exposure, with initial setup costs ranging from $15,000 to $50,000 for broker relationships and trading infrastructure. Smaller operations can access hedging through third-party platforms or natural hedging strategies with minimal upfront investment, focusing on supply chain integration and indexed contracts instead of derivatives.
Does hedging always reduce my overall procurement costs?
No, hedging reduces cost volatility and risk rather than absolute costs. If commodity prices move favorably after you hedge, you may end up paying more than unhedged buyers, but the predictability protects project margins and enables more confident financial planning. The value lies in eliminating budget-breaking surprises rather than guaranteed savings.
How do I measure whether my hedging strategy is actually working?
Evaluate hedging effectiveness by comparing realized procurement costs against budget targets and measuring variance reduction, not against perfect hindsight scenarios. Track metrics like hedge ratio effectiveness, basis risk exposure, and the percentage of your commodity budget protected within acceptable variance bands, integrating these measurements with broader procurement performance indicators like KPIV KPOV frameworks that link input variables to procurement outcomes.
What are the tax implications of commodity hedging for PV manufacturers?
Hedging gains and losses typically receive different tax treatment depending on whether positions qualify as bona fide hedges under IRS regulations versus speculative trades. Qualified hedges may allow ordinary income treatment and hedge accounting that matches gains and losses with the underlying commodity purchases, but tax treatment varies significantly by jurisdiction and corporate structure, requiring consultation with tax professionals familiar with commodity derivatives.
Where can I learn more about commodity risk management specific to solar procurement?
Mose Solar offers educational program offerings developed in collaboration with universities that provide targeted training on PV commodity risk management, covering both financial theory and practical implementation. These programs combine academic research on commodity markets with real-world solar procurement scenarios, offering certification pathways for professionals building expertise in this specialized intersection of finance and renewable energy.
At what point does hedging become too expensive to justify?
Hedging becomes cost-prohibitive when the total cost of protection exceeds 5-8% of the commodity value being hedged, or when your commodity exposure is so small that fixed costs overwhelm the risk reduction benefit. For procurement volumes below $250,000 annually, focus on supplier diversification and flexible contracts rather than formal hedging programs.
Can I hedge only my most volatile commodities and leave others unhedged?
Yes, selective hedging is common and often more cost-effective than comprehensive programs. Most PV manufacturers prioritize hedging polysilicon and silver due to their high volatility and material cost impact, while accepting exposure on more stable commodities like aluminum or managing them through long-term fixed-price contracts. The key is matching hedge coverage to where price swings would most damage your margins.
How often should I review and adjust my hedging strategy?
Review hedging positions quarterly at minimum, with monthly check-ins during periods of high market volatility or significant changes in your production pipeline. Major strategy adjustments typically happen annually during budget planning cycles, but tactical position adjustments may be needed whenever your procurement forecast changes by more than 15-20% or when commodity fundamentals shift dramatically.
These questions reflect the real learning curve that procurement teams face when first implementing commodity risk management in solar manufacturing. The answers balance practical cost considerations with strategic thinking, recognizing that hedging is not a set-and-forget solution but an active discipline requiring ongoing education and adjustment. For professionals serious about mastering these concepts, structured learning through programs that combine academic rigor with industry practice provides the foundation for confident decision-making in this complex but increasingly essential area of PV procurement management.
Understanding commodity price risk hedging costs, ranging from 0.5% to 5% of contract value depending on commodity volatility, hedge duration, and strategy complexity, enables PV procurement professionals to make informed decisions about margin protection. The question is not whether hedging carries costs, but whether those costs represent prudent insurance against potentially catastrophic price swings that could eliminate project profitability entirely.
A 2% hedging cost on a $10 million polysilicon procurement contract amounts to $200,000. Without hedging, a 15% adverse price movement creates a $1.5 million exposure. This framework shifts the evaluation from viewing hedging as discretionary expense to recognizing it as strategic investment in financial predictability. For developers working on fixed-price PPA contracts or manufacturers committing to delivery schedules months in advance, hedging transforms uncertain procurement budgets into manageable, forecasted costs.
The appropriate hedging approach depends on procurement volume, risk tolerance, and internal capabilities. Smaller operations may find natural hedging and selective option strategies sufficient, while large-scale manufacturers benefit from comprehensive derivatives programs despite higher upfront costs. Building this expertise requires dedicated study of commodity markets, derivatives pricing, and PV supply chain dynamics.
Mose Solar’s educational program offerings, developed in collaboration with universities, provide aspiring and current PV professionals with practical frameworks for evaluating commodity risk management strategies. These programs bridge academic financial theory with real-world procurement challenges, equipping industry stakeholders to navigate commodity volatility confidently and protect their organizations’ financial health in an increasingly complex global supply environment.