The NREL photovoltaic efficiency chart serves as the solar industry’s definitive reference for cell and module performance, tracking certified conversion efficiencies across every major technology from crystalline silicon to emerging perovskite architectures. For professionals conducting pre-feasibility analysis, this chart translates directly into system sizing requirements, energy yield projections, and technology selection decisions that shape project economics before a single panel is procured.
Published continuously since 1976 and updated multiple times annually by the National Renewable Energy Laboratory, the chart documents laboratory-verified efficiency records under standard test conditions (1000 W/m², 25°C, AM1.5 spectrum). As of 2026, top-performing crystalline silicon cells exceed 27% efficiency, multijunction concentrator cells approach 48%, and commercial thin-film modules range from 18% to 23%, depending on material composition. These benchmarks matter because efficiency directly governs land area, balance-of-system costs, and levelized cost of energy in utility-scale deployments.
Understanding how to extract actionable data from the NREL chart requires more than reading percentage values. Pre-feasibility screening demands interpretation of technology maturity, commercial availability versus research cells, temperature coefficients, and degradation profiles that the chart itself doesn’t explicitly capture. A 24% lab cell efficiency means little if the corresponding commercial module delivers 21% with a 20-year warranty, or if bifacial gain assumptions inflate yield models beyond realistic site conditions.
This article provides a practical framework for applying NREL efficiency data during early-stage project assessment. You’ll learn to differentiate between research breakthroughs and deployable technologies, calculate area-specific yield using efficiency as the anchor variable, and integrate chart data with resource assessment tools to produce defensible pre-feasibility outputs that withstand investor scrutiny.
Understanding the NREL PV Efficiency Chart
Technology Categories and Color Coding
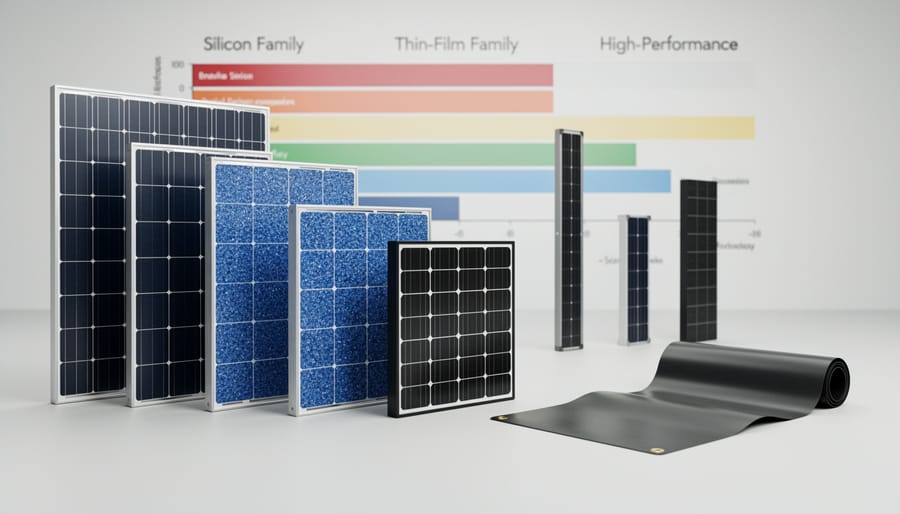
The NREL chart uses a color-coding system that groups solar cell technologies into distinct families based on their material composition and device architecture. Each color represents a specific technology trajectory, making it easier to track progress within comparable approaches rather than mixing fundamentally different cell designs.
Crystalline silicon cells, marked in shades of green, dominate the commercial market and represent the most mature technology category. This family includes both monocrystalline and polycrystalline silicon cells, with subcategories for passivated emitter and rear contact (PERC) designs and interdigitated back contact (IBC) architectures. When you see efficiency records in this color range approaching 27%, you’re looking at technologies that can typically be purchased as commercial modules today, though module-level efficiency will be several percentage points lower than these record cell values.
Thin-film technologies appear in orange and brown tones, encompassing cadmium telluride (CdTe), copper indium gallium selenide (CIGS), and amorphous silicon. These cells use significantly less semiconductor material than crystalline silicon and can be manufactured on flexible substrates. While their efficiency records trail crystalline silicon by roughly 5-8 percentage points, they offer advantages in specific applications like building-integrated photovoltaics or low-light conditions. CdTe modules, for instance, have carved out a substantial utility-scale niche despite lower peak efficiency.
Multi-junction cells, shown in blue and purple, represent the efficiency frontier, with records exceeding 47% under concentrated sunlight. These sophisticated devices stack multiple semiconductor layers to capture different portions of the solar spectrum. However, their complexity and cost limit them almost exclusively to space applications and concentrating photovoltaic (CPV) systems. During pre-feasibility screening for terrestrial projects, these records serve primarily as aspirational benchmarks rather than practical options.
Emerging technologies occupy the chart’s right edge in varied colors, tracking perovskites, organic cells, quantum dots, and other experimental approaches. These represent research-stage innovations with uncertain commercial timelines. Their inclusion helps you monitor which new technologies show sustained improvement versus those that plateau, informing long-term technology roadmap planning even if they aren’t viable for current projects.
How Efficiency Records Are Validated
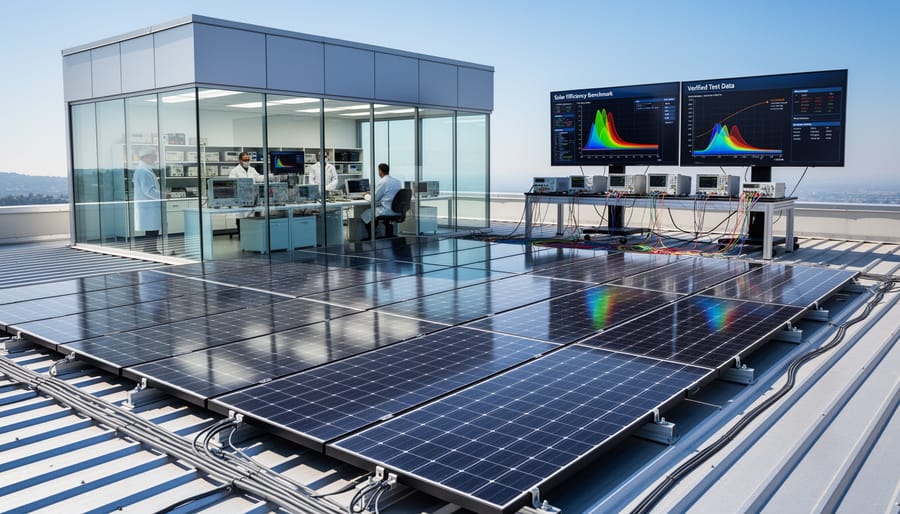
NREL’s efficiency validation process ensures that every data point on its renowned chart meets strict scientific standards. When a research team or manufacturer claims a new efficiency record, they must submit their solar cell to an accredited testing laboratory for independent verification. NREL itself performs many of these measurements at its facility in Golden, Colorado, while other internationally recognized laboratories, such as Fraunhofer ISE in Germany or AIST in Japan, also conduct certified testing.
The validation follows a standardized protocol under specific conditions. Standard Test Conditions require measurements at 25°C cell temperature, 1000 watts per square meter irradiance, and the AM1.5G solar spectrum (which represents sunlight passing through 1.5 times the thickness of Earth’s atmosphere). These parameters create a level playing field, allowing direct comparison between vastly different technologies. Without STC, a cell tested on a cold morning might appear more efficient than one tested at midday, making meaningful comparison impossible.
A critical distinction for pre-feasibility screening is understanding lab-scale versus commercial efficiency. The record-breaking cells on the NREL chart often measure just one square centimeter and exist as research prototypes. They demonstrate what’s theoretically achievable but aren’t yet manufactured at scale. Commercial module efficiency, what you can actually purchase and install, typically lags 5-10 percentage points behind these research records. Multi-junction cells might achieve 39% efficiency in the lab, but commercially available silicon modules peak around 22-24% as of 2026.
This gap reflects manufacturing realities: scaling up production, encapsulating cells into weather-resistant modules, managing electrical losses, and maintaining cost-effectiveness all reduce the final efficiency that reaches rooftops and solar farms. When conducting preliminary assessments, always reference commercially available module specifications rather than research cell records to avoid overestimating project performance.
Applying the NREL Chart to Pre-Feasibility Screening
Matching Technology Efficiency to Project Requirements
Choosing the right PV technology during pre-feasibility screening starts with matching efficiency benchmarks from the NREL chart to your project’s physical and financial constraints. A rooftop installation on Q-Deck roofs with limited area demands high-efficiency monocrystalline silicon cells (22-24% range) to maximize output per square meter, whereas a utility-scale ground mount with abundant land can often achieve cost targets using standard polycrystalline or lower-tier monocrystalline modules (18-20% efficiency) at a lower cost per watt.
| Technology Type | NREL Efficiency Range | Ideal Applications | Pre-Feasibility Considerations |
|---|---|---|---|
| Monocrystalline Silicon (high-efficiency) | 22-24% | Space-constrained rooftops, urban C&I projects | Higher upfront cost justified by limited area; verify ROI against land/roof lease premiums |
| Standard Crystalline Silicon | 18-20% | Utility-scale ground mounts, large rural sites | Lower $/W but requires more land; confirm site size supports target capacity before environmental assessments |
| Thin Film (CdTe, CIGS) | 15-19% | Large ground arrays, low-cost land scenarios | Lowest $/W but highest land requirement; better temperature coefficients may offset lower efficiency in hot climates |
| Multi-junction (III-V) | 35-47% | Concentrator systems, specialized applications | Extreme efficiency but requires tracking, direct irradiance, and high capital investment; rarely suitable for standard pre-feasibility screening |
Calculate the trade-off by dividing total project budget by target installed capacity to establish your maximum allowable cost per watt, then work backwards: if land is expensive or scarce, the premium for high-efficiency modules often pays for itself through reduced balance-of-system costs (fewer mounting structures, less wiring, smaller inverters). Conversely, if land acquisition is cheap and permitting straightforward, spreading a lower-efficiency array across a larger footprint typically delivers better financial metrics. Run sensitivity analyses during pre-feasibility to test whether a 2-3 percentage point efficiency gain justifies the 10-20% module cost increase for your specific site conditions and offtake agreement structure.
Estimating System Capacity and Land Requirements
Once you’ve selected a target efficiency from the NREL chart, you can translate that figure into tangible system parameters through straightforward calculations. Start with your available land area and work backward: multiply the usable array footprint (accounting for setbacks, access roads, and shading buffers identified during land feasibility analysis) by your site’s ground coverage ratio. For a typical fixed-tilt ground-mount array, this ratio ranges from 0.35 to 0.45, depending on row spacing and latitude.
Next, apply the module efficiency from the NREL chart to the net array area. If you have 10,000 square meters of usable array space and modules rated at 22 percent efficiency, expect roughly 2.2 MW of DC capacity (10,000 m² × 0.22 × 1,000 W/m² standard irradiance). Drop that efficiency to 19 percent with standard crystalline silicon modules, and the same footprint yields only 1.9 MW, a 300 kW difference that compounds through every stage of project economics.
The impact becomes stark when space is constrained. Consider a commercial rooftop with 2,000 square meters available after accounting for equipment, walkways, and structural limitations relevant to B-Roof design considerations. Premium modules at 23 percent efficiency deliver 460 kW DC, while standard 20 percent modules max out at 400 kW. That 60 kW gap represents 13 percent less revenue over the project’s lifetime, often enough to justify the premium module cost.
For preliminary energy yield, multiply your estimated DC capacity by site-specific full-sun hours (peak sun hours per day) and a conservative performance ratio of 0.75 to 0.80 at pre-feasibility stage. A 2 MW system in a location averaging 5.5 peak sun hours produces approximately 8,250 kWh daily (2,000 kW × 5.5 hours × 0.75), or roughly 3,000 MWh annually. Higher efficiency modules let you hit the same output target on 10 to 15 percent less land, which matters significantly when site area drives project feasibility or when lease costs penalize sprawl.
Interpreting Efficiency Trends for Technology Selection
The NREL chart displays efficiency progression over time through a scatter plot format, where each data point represents a validated record for a specific technology at a particular moment. Reading these patterns correctly helps you distinguish between technologies approaching their theoretical limits and those still rapidly improving. A steep upward trajectory indicates active research momentum and potential for future gains, while a flattening curve suggests a technology nearing its practical efficiency ceiling. For pre-feasibility screening, these trend lines reveal which technologies are mature enough for commercial deployment and which remain experimental.
Crystalline silicon technologies show a gradual, steady climb that has continued for decades, reflecting incremental improvements through manufacturing optimization and cell design refinements. By contrast, perovskite solar cells exhibit a near-vertical rise beginning around 2010, jumping from roughly 3% to over 25% efficiency within fifteen years. This dramatic trajectory signals breakthrough potential but also highlights commercial immaturity, rapid lab gains don’t automatically translate to reliable, cost-effective modules at scale.
The gap between research cell records and commercially available module efficiency matters significantly during feasibility assessment because it affects your realistic energy yield projections and system sizing calculations. A research cell represents a small, optimized device tested under controlled laboratory conditions, often using expensive materials or processes unsuitable for mass production. Commercial modules, meanwhile, integrate multiple cells with interconnects, glass, frames, and encapsulation, all of which introduce optical losses, resistance losses, and area-related derating.
For established technologies like monocrystalline silicon, the gap is narrower (around 3-4 percentage points) because manufacturing processes are highly refined. Multi-junction cells used in concentrator systems show wider gaps, sometimes exceeding 10 percentage points, due to the complexity of scaling laboratory prototypes to commercial production. Emerging technologies like organic photovoltaics or quantum dot cells often display 8-10 percentage point differences, reflecting their early development stage and the substantial engineering required to move from proof-of-concept to market-ready products.
When screening technologies for a project, prioritize those where the record efficiency has remained near the top of its trend line for several consecutive years, indicating sustained performance rather than a one-time anomaly. Check whether multiple research groups or manufacturers have achieved similar efficiency levels, convergence of results across independent labs suggests reproducibility and commercial readiness. A single outlier record, while scientifically interesting, provides little assurance for near-term project planning.
Integrating Efficiency Data with Resource Assessment
Temperature Coefficients and Real-World Performance

While the NREL efficiency chart provides a crucial baseline for technology comparison, those efficiency values represent performance under Standard Test Conditions (STC), 25°C cell temperature, 1000 W/m² irradiance, and AM 1.5 spectrum. Real-world PV modules rarely operate at these conditions. Understanding temperature coefficients becomes essential during pre-feasibility screening because cell temperature routinely exceeds 25°C in most climates, directly impacting actual energy output.
Temperature coefficients measure how much a module’s power output declines for each degree Celsius above STC. This metric varies significantly across the technology families shown in the NREL chart. Crystalline silicon modules typically exhibit temperature coefficients around -0.35% to -0.45% per °C, meaning a module operating at 65°C (common in hot climates) loses 14-18% of its nameplate power compared to STC ratings. Thin-film technologies like cadmium telluride (CdTe) and certain copper indium gallium selenide (CIGS) variants show better temperature resilience, with coefficients around -0.25% to -0.32% per °C.
Multi-junction concentrator cells tracked separately on the NREL chart face even steeper temperature dependencies, often requiring active cooling systems. Emerging perovskite technologies show promise for lower temperature coefficients, though long-term field data remains limited.
For pre-feasibility screening, combine the efficiency data from the NREL chart with site-specific climate analysis. Calculate expected operating temperatures using ambient temperature, irradiance levels, and mounting configuration (rooftop versus ground-mount affects cooling). A project in Phoenix with 45°C summer ambient temperatures might see module temperatures exceeding 75°C, making CdTe’s lower temperature coefficient advantageous despite its lower STC efficiency compared to monocrystalline silicon. Conversely, installations in cooler climates benefit less from temperature-resilient technologies, allowing higher initial efficiency to dominate technology selection. Always adjust nameplate capacity by expected temperature-related losses before finalizing preliminary yield estimates.
Educational Resources and Professional Development
Professional competence with tools like the NREL PV efficiency chart requires structured learning that bridges theoretical understanding and practical application. Many aspiring photovoltaic professionals struggle to translate raw efficiency data into actionable project decisions during pre-feasibility screening, a gap that dedicated training programs address through hands-on curriculum design.
Mose Solar’s educational program, developed in collaboration with universities, equips participants with the analytical frameworks needed to properly interpret efficiency benchmarks and apply them to real-world resource assessment scenarios. The curriculum integrates case studies demonstrating how technology selection decisions change based on site-specific constraints, budget parameters, and efficiency differentials shown in the NREL chart.
Core modules cover resource assessment fundamentals, teaching students to correlate irradiance data with efficiency values to generate preliminary yield estimates. Participants learn systematic approaches to technology selection by evaluating trade-offs between high-efficiency options and cost-effective alternatives, using actual project examples where land availability or financial constraints drive different outcomes. Yield modeling instruction emphasizes the conversion pathway from chart efficiency figures through temperature derating and system losses to final performance ratio calculations.
The program also addresses emerging technologies tracked by NREL, preparing professionals to evaluate when nascent high-efficiency solutions warrant consideration during feasibility screening versus proven commercial options. This comprehensive approach ensures graduates can confidently navigate pre-feasibility analysis with the NREL chart as a foundation tool, not just a reference document.
Common Questions About the NREL PV Efficiency Chart
During pre-feasibility screening, PV professionals frequently encounter practical questions about interpreting and applying the NREL efficiency chart to real-world project contexts. Understanding these nuances helps avoid common pitfalls in technology selection and yield estimation.
How often does NREL update the efficiency chart?
NREL typically updates the chart twice per year, though the exact timing varies based on validated record submissions from research institutions and manufacturers. Major updates usually occur in mid-year and at year-end, incorporating newly verified efficiency achievements across all technology categories.
Why is there such a large gap between cell efficiency and module efficiency?
Research cells represent small-scale laboratory achievements under ideal conditions, while commercial modules must account for additional components like glass, frames, encapsulants, and interconnections that reduce overall efficiency. Module efficiency typically runs 2-5 percentage points lower than record cell efficiency for the same technology family.
Does the chart account for bifacial module performance gains?
The NREL chart reports front-side efficiency only under standard test conditions. For bifacial modules, you need to separately estimate the rear-side energy gain based on site-specific albedo and mounting configuration, typically adding 5-25% to total energy yield depending on installation design.
Should emerging technologies on the chart be considered for commercial projects?
Emerging technologies with recent efficiency records often lack commercial availability, bankability, and long-term performance data needed for project financing. For pre-feasibility screening of commercial projects, focus on technologies with established manufacturing capacity and proven field performance records rather than cutting-edge laboratory achievements.
The distinction between laboratory achievements and commercially deployable technology represents one of the most critical considerations during feasibility assessment. Technologies appearing near the top of the chart may demonstrate impressive efficiency but remain years away from cost-effective manufacturing at scale. Crystalline silicon and established thin-film technologies dominate commercial installations precisely because they balance efficiency with proven reliability, bankability, and supply chain maturity.
When using efficiency data for financial modeling during pre-feasibility screening, conservative assumptions protect project viability. Module efficiency typically degrades 0.5-0.7% per year for crystalline silicon technologies, and this degradation must factor into 25-30 year energy yield projections. Additionally, the gap between STC efficiency ratings and actual field performance requires applying appropriate derating factors for soiling, shading, wiring losses, inverter efficiency, and temperature effects.
For projects considering technologies with limited commercial history, efficiency projections carry higher uncertainty. Perovskite solar cells, for example, show remarkable laboratory efficiency gains on the NREL chart but face durability challenges that make long-term performance projections speculative. During pre-feasibility screening, emerging technology selections demand thorough risk assessment and contingency planning that established technologies do not require.
The chart serves as a starting reference point rather than a complete specification for project planning. Combine efficiency benchmarks with manufacturer datasheets, independent testing reports, and site-specific performance modeling to generate realistic yield estimates. This layered approach accounts for real-world conditions that laboratory test environments cannot capture, producing feasibility assessments that withstand the scrutiny of technical due diligence and lender review processes.