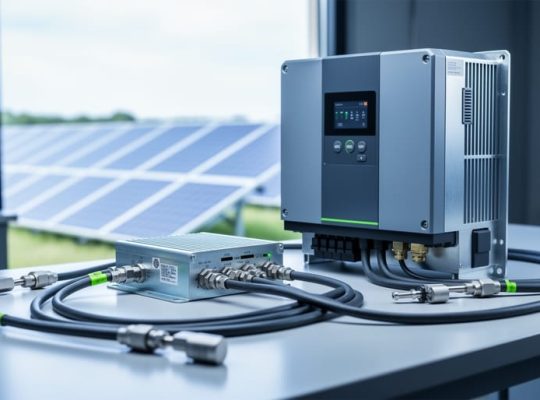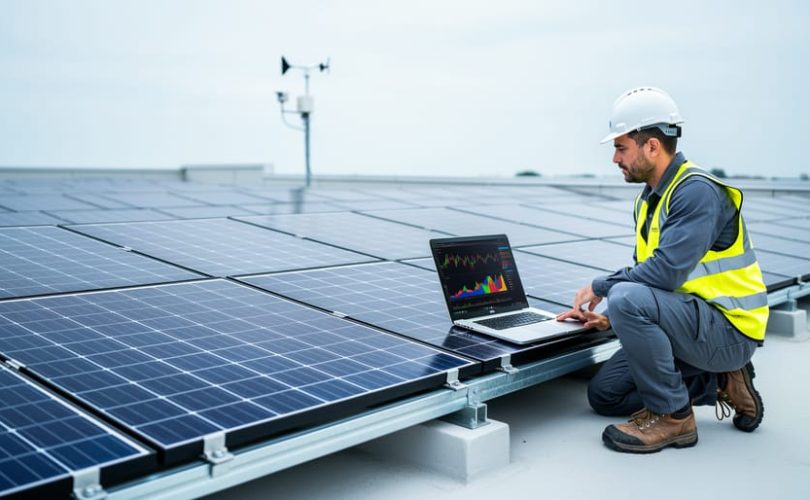
R forecasting packages are specialized software libraries within the R programming environment designed to model and predict future photovoltaic (PV) power generation based on historical data, weather patterns, and operational parameters. These packages provide the statistical and machine learning frameworks necessary for solar energy professionals to anticipate power output across timescales ranging from minutes to years, enabling better grid integration, market participation, and system planning.
Accurate solar forecasting has become essential as photovoltaic installations reach unprecedented grid penetration levels in 2026. Grid operators require advance notice of generation variability to balance supply and demand, while project developers use forecasts to optimize battery storage dispatch and maximize revenue in electricity markets. The challenge lies not in data availability but in selecting and implementing the right analytical tools for specific forecasting horizons and accuracy requirements.
R has emerged as a preferred platform for solar forecasting due to its extensive collection of time series analysis packages, active development community, and seamless integration with weather data sources and operational databases. Unlike proprietary forecasting solutions, R packages offer transparency in methodology, customization for site-specific conditions, and zero licensing costs. However, the ecosystem includes dozens of packages with overlapping capabilities, making informed selection critical for practitioners.
This article clarifies which R forecasting packages address specific PV prediction challenges, from simple persistence models to complex ensemble methods combining numerical weather prediction with machine learning. We explain how these tools process input data, generate probabilistic forecasts, and interface with grid management systems. Whether you’re a researcher developing novel forecasting approaches through university collaborations, a grid operator implementing day-ahead predictions, or a student enrolled in renewable energy educational programs seeking practical skills, understanding the R forecasting landscape provides both conceptual foundations and actionable implementation guidance for solar power prediction workflows.
What R Forecasting Packages Are
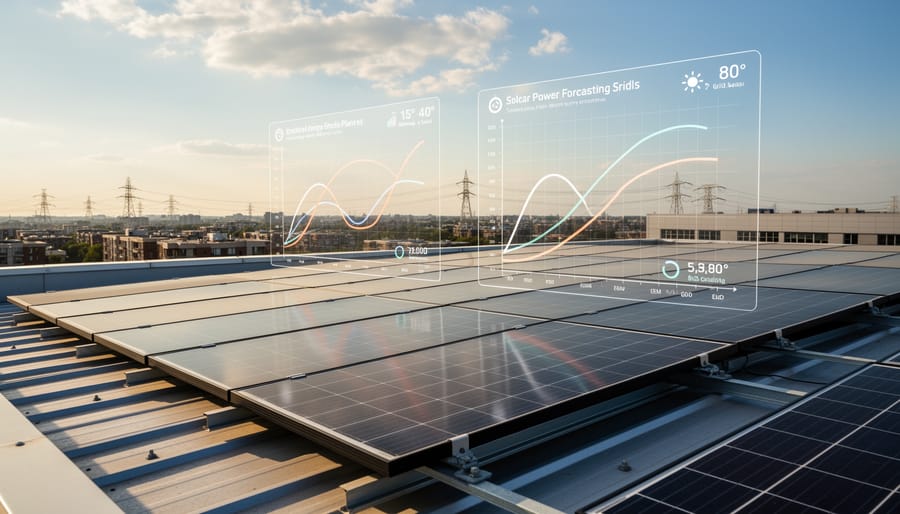
R forecasting packages are specialized collections of open-source statistical functions and algorithms built within the R programming environment, designed to analyze historical data patterns and generate predictions about future values. In photovoltaic applications, these packages transform raw meteorological records, irradiance measurements, and past generation data into actionable forecasts that help grid operators anticipate solar power production hours or days ahead.
Unlike proprietary forecasting systems that require expensive licenses, R packages offer photovoltaic professionals freely accessible tools backed by global academic communities. A single package might contain dozens of forecasting methods, from simple moving averages to sophisticated machine learning algorithms, all tested and documented by researchers worldwide. For solar applications specifically, these tools excel at handling the non-linear relationships between weather variables and panel output, accounting for seasonal patterns, cloud movement, and temperature effects that determine how much electricity a grid-connected PV array will produce.
- R language
- An open-source programming environment built for statistical computing and graphics, widely adopted in energy research for its extensive package ecosystem and reproducible analysis workflows.
- Time series forecasting
- A statistical method that uses sequential historical observations to predict future values, essential for solar forecasting where generation patterns follow daily, seasonal, and weather-driven cycles.
- PV output prediction
- The process of estimating future electricity generation from photovoltaic systems based on expected irradiance, temperature, and system characteristics.
- Grid integration
- The coordination of variable renewable energy sources with conventional generation and demand, requiring accurate forecasts to maintain system stability and optimize resource dispatch.
The platform has become essential in academic and professional PV forecasting because it bridges research and practice. University researchers develop cutting-edge forecasting methods as R packages, which grid operators and energy traders can then deploy directly without reimplementation. This rapid knowledge transfer, combined with R’s ability to process millions of data points and visualize forecast uncertainty, makes it invaluable for professionals managing solar assets in competitive electricity markets where prediction errors translate to financial penalties.
How R Forecasting Packages Work for PV Applications
Data Input and Preprocessing
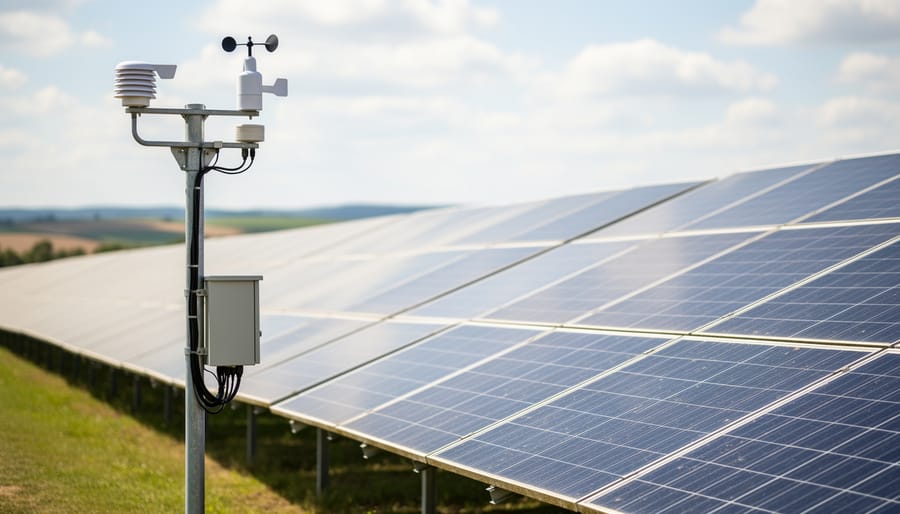
Data input and preprocessing form the foundation of accurate PV forecasting in R. The quality of predictions depends directly on how well you prepare the raw data before feeding it into forecasting models.
R forecasting packages require three primary data categories. Meteorological variables include global horizontal irradiance (GHI), direct normal irradiance (DNI), diffuse horizontal irradiance (DHI), temperature, humidity, cloud cover, and wind speed. Historical PV generation data provides the actual power output records from your system, typically measured at 15-minute to hourly intervals. Geographic factors encompass latitude, longitude, altitude, panel tilt angle, azimuth, and shading patterns that influence site-specific performance.
R packages like tidyverse and lubridate handle the essential preprocessing tasks. Missing values get identified and addressed through interpolation or forward-filling techniques, which forecast prevents from breaking the time series continuity. Outliers from sensor errors or grid curtailment events require filtering to avoid skewing model training. Time stamps need standardization to a consistent timezone and format, ensuring proper temporal alignment between weather data and generation records.
Normalization transforms variables to comparable scales. Temperature might range from negative values to 40°C while irradiance spans zero to 1200 W/m², so scaling prevents larger-magnitude variables from dominating the model. R’s scale function or custom normalization routines typically handle this step.
The tsibble package structures cleaned data into time series objects that forecasting algorithms recognize, establishing the regular temporal index that time series models require. This preparation determines whether your forecasting model can extract meaningful patterns or simply processes noise.
Model Training and Validation
Training a forecasting model in R begins with partitioning your historical dataset, typically splitting PV output and weather records into training and testing subsets. The training set, often comprising 70-80% of available data, teaches the model the relationships between meteorological inputs and power generation patterns. Models learn seasonal cycles, cloud effects, and temperature-dependent efficiency changes through iterative optimization of their internal parameters.
Validation prevents overfitting, where a model memorizes training data but fails on new observations. Cross-validation techniques divide the dataset into multiple folds, training on some while testing on others, then rotating which fold serves as the test set. For PV applications, time series cross-validation respects temporal ordering, you cannot validate using data from before your training period, as this would leak future information into past predictions. Rolling-origin validation simulates real forecasting by incrementally expanding the training window and testing on the next time step.
Accuracy assessment relies on metrics tailored to solar forecasting. Mean Absolute Error (MAE) measures average prediction deviation in kilowatts, giving operators a sense of typical errors. Root Mean Square Error (RMSE) penalizes large misses more heavily, crucial for grid stability planning. The normalized versions, nMAE and nRMSE, express errors as percentages of installed capacity, enabling comparisons across different PV installations. Skill score compares your model against a naive persistence forecast (assuming tomorrow equals today), with positive scores indicating genuine predictive value.
Refinement cycles adjust model hyperparameters, feature selection, and data preprocessing based on validation results until error metrics stabilize at acceptable levels for operational deployment.
Leading R Packages for PV Forecasting
Time Series Forecasting Packages
The forecast package remains the foundational tool for PV forecasting, offering ARIMA, exponential smoothing, and seasonal decomposition methods that handle the cyclical patterns inherent in solar generation. Its auto.arima() function automatically selects optimal model parameters for daily irradiance cycles, while ets() handles seasonal fluctuations across months. Grid operators use these models for 24-hour and 48-hour forecasts that inform dispatch scheduling and balancing reserve allocation.
The tidyverts ecosystem, comprising tsibble, fable time series forecasting and feasts packages, represents the modern evolution of time series analysis in R. The tsibble structure organizes PV output data with explicit temporal indexing, accommodating irregular measurement intervals from power meters and weather stations. Fable extends forecast’s capabilities with cleaner syntax and better handling of multiple seasonal patterns (daily, weekly, annual), crucial for capturing both weather-driven and calendar-based variations in solar output.
Prophet, developed by Facebook, excels at forecasting with missing data and abrupt changes, common in PV datasets affected by equipment maintenance or weather disruptions. Its additive model separates trend, seasonality, and holiday effects, making it particularly effective for long-term capacity planning and multi-year generation projections. The package handles uncertainty estimation natively, providing confidence intervals that inform risk management in energy trading decisions.
For specialized applications, the smooth package implements state-space models that capture complex seasonal interactions, while the bsts package (Bayesian structural time series) quantifies uncertainty through probabilistic forecasting, increasingly required for participating in reserve markets where forecast confidence levels directly affect capacity payments.
Machine Learning and Hybrid Packages
Machine learning packages in R excel at capturing the complex, non-linear interactions between meteorological variables and PV generation that simpler statistical models miss. The caret package provides a unified interface for training and comparing dozens of ML algorithms, from support vector machines to gradient boosting, making it straightforward to test which approach best fits your site’s specific conditions. randomForest builds ensemble models that average predictions from hundreds of decision trees, proving particularly effective when irradiance varies rapidly due to cloud movement or when panel orientation creates asymmetric response curves.
For PV applications connected through utility interactive invertershybrid packages combine classical time series methods with machine learning to exploit both temporal patterns and instantaneous weather relationships. The h2o package implements deep neural networks and distributed computing for large-scale forecasting across multiple sites simultaneously. nnetar from the forecast ecosystem applies neural networks specifically to time series data, automatically handling lagged values and seasonal patterns. glmnet handles high-dimensional predictor sets through regularization, useful when incorporating satellite imagery, numerical weather model outputs, and local sensor data simultaneously without overfitting. These ML approaches typically outperform traditional methods during periods of high variability but require more training data and computational resources to achieve stable performance.
Specialized Solar and Weather Packages
While general forecasting packages handle the statistical modeling, specialized solar and weather tools provide the domain-specific calculations that underpin accurate PV predictions. These packages eliminate the need to code solar geometry, atmospheric physics, and panel performance models from scratch, giving forecasters pre-built functions calibrated to photovoltaic applications.
The solaR package stands out for its comprehensive solar radiation and PV system simulation capabilities. It calculates irradiance on tilted surfaces, accounts for shading losses, estimates optimal tilt angles, and converts meteorological inputs into expected power output. Researchers use solaR to generate baseline production estimates and to understand how geographic location, panel orientation, and seasonal variation affect forecast accuracy.
For more granular irradiance calculations, many practitioners adapt Python’s pvlib irradiance modeling functions alongside R workflows, or they replicate its methods using R’s computational tools. This approach handles diffuse and direct component separation, transposition models for tilted arrays, and spectral corrections that improve forecast precision under varying atmospheric conditions.
Weather data integration packages like rnoaa and worldmet pull historical and real-time meteorological variables directly into R, streamlining the data pipeline. They retrieve temperature, cloud cover, humidity, and wind speed from national weather services and research networks, ensuring forecasters work with consistent, quality-controlled inputs rather than manually downloading and formatting files.
Together, these specialized tools bridge the gap between raw weather data and actionable PV forecasts, handling the physics and data acquisition so modelers can focus on refining statistical predictions.
Integration with Grid Operations and Energy Markets

Day-Ahead and Intraday Market Applications
Day-ahead markets require PV generators to submit generation bids 12-36 hours before delivery, creating a critical need for accurate R-based forecasts. These packages analyze historical weather patterns, numerical weather prediction models, and seasonal variations to predict hourly PV output for the next day’s trading window. A producer using the `forecast` or `fable` package can submit confident bids based on predicted generation, locking in prices before real-time delivery. Forecast errors here translate directly to imbalance penalties, if actual output falls short of the bid, the generator must purchase makeup power at potentially higher spot prices, while excess generation sells at lower rates.
Intraday markets operate on shorter horizons, from several hours down to 15-minute intervals before delivery. R packages handle these rapid updates by ingesting real-time weather telemetry, satellite cloud tracking, and on-site irradiance sensors. The `tsibble` package excels at managing high-frequency data streams, refining predictions as delivery approaches. Grid operators rely on these increasingly accurate short-term forecasts to understand how PV powers the grid moment-to-moment, adjusting reserve allocations and minimizing costly balancing actions.
Accuracy standards differ sharply between timeframes. Day-ahead forecasts achieving 10-15% mean absolute error are commercially acceptable, while intraday forecasts must reach 5-8% error or better to reduce financial exposure. Ensemble methods combining multiple R packages often outperform single-model approaches, blending statistical time series techniques with machine learning corrections to meet these stringent market requirements.
Grid Stability and Reserve Management
Accurate PV forecasts are critical for maintaining grid stability as solar penetration increases. Grid operators use R-generated forecasts to anticipate ramping events, sudden changes in solar output caused by cloud cover or weather fronts, and schedule responsive reserves accordingly. When forecasts predict a steep decline in PV generation during evening hours, operators can pre-position spinning reserves or schedule quick-start natural gas plants to fill the gap without compromising frequency control.
Frequency stability depends on continuously balancing generation and load within tight tolerances, typically ±0.1 Hz from nominal. Short-term forecasts with 15-minute to 1-hour horizons allow operators to activate automatic generation control systems before imbalances cascade into frequency deviations. Packages like forecast and fable provide the probabilistic confidence intervals operators need to size reserves appropriately, wider uncertainty bands require larger reserve margins.
Voltage management presents distinct challenges in high-PV distribution networks. Rapid irradiance changes can cause voltage swings that exceed equipment tolerances, particularly in weak grid areas with high impedance. R forecasting models that incorporate spatial correlation between nearby PV sites help grid operators predict localized voltage issues and coordinate reactive power support from inverters or capacitor banks. This proactive approach prevents costly equipment damage and maintains power quality standards across the distribution system.
Practical Considerations for Implementation

Successfully implementing R forecasting packages for PV systems requires careful attention to infrastructure, data management, and operational realities that textbooks rarely cover. The gap between running a model in RStudio and deploying it for daily grid operations involves technical hurdles and organizational considerations that can make or break a forecasting system’s value.
Computational resources present the first practical challenge. While basic time series models run efficiently on standard workstations, ensemble methods combining multiple forecasting approaches or neural networks processing high-resolution satellite imagery demand substantial processing power. A single forecast run incorporating ten years of hourly data across multiple weather variables might consume 4-8 GB of RAM and require 15-30 minutes on a typical server. Organizations must decide whether to invest in dedicated forecasting servers, leverage cloud computing for peak loads, or accept longer processing times with existing hardware. Real-time forecasting systems need enough capacity to generate updated predictions every 15-60 minutes without creating processing backlogs.
Data quality and availability determine forecast accuracy more than algorithm sophistication. Missing weather observations, gaps in historical PV output records, or inconsistent timestamp formatting will degrade any model’s performance. Establishing automated data validation routines that flag anomalies, interpolate short gaps intelligently, and alert operators to sensor failures prevents garbage-in-garbage-out scenarios. Most successful implementations dedicate 40-60% of development time to data pipeline construction rather than model refinement.
Update frequency requires balancing accuracy gains against operational complexity. Weather patterns and PV system characteristics change gradually, so daily model retraining offers minimal improvement over weekly or monthly schedules for most applications. The exception involves forecasting systems deployed immediately after panel cleaning, inverter replacement, or seasonal transitions, where recalibrating models with fresh data captures performance shifts quickly. A practical compromise involves full model retraining monthly with daily coefficient updates for adaptive methods like exponential smoothing.
Integration with existing infrastructure demands attention to data formats, communication protocols, and failover procedures. SCADA systems, energy management platforms, and trading software typically expect forecast data in specific formats delivered via particular protocols. Building robust API connections, implementing automatic retry logic for network failures, and maintaining backup forecast sources prevents operational disruptions when R processes crash or data feeds drop. Documentation of integration points and handoff procedures ensures continuity when personnel change.
Accuracy expectations must align with physical and statistical realities rather than wishful thinking. Day-ahead PV forecasts typically achieve 10-15% root mean square error under favorable conditions, degrading to 20-25% during transitional weather. Hour-ahead forecasts improve to 5-10% error, while week-ahead predictions rarely exceed 70% accuracy. Setting appropriate thresholds helps organizations budget reserves, price imbalance risk correctly, and avoid over-investment in marginal accuracy improvements that deliver limited operational value.
Educational Pathways and Professional Development
Developing expertise in R-based PV forecasting requires a combination of statistical knowledge, programming skills, and domain understanding of solar energy systems. Universities with renewable energy programs increasingly incorporate R programming and time series analysis into their curricula, providing foundational training in both the statistical methods and the photovoltaic context necessary for effective forecasting work.
Mose Solar’s educational programs bridge the gap between academic theory and industry practice by offering hands-on training in real-world forecasting scenarios. These programs emphasize practical implementation, teaching participants how to select appropriate packages, preprocess utility-scale PV data, and validate model performance against operational benchmarks. Collaboration with university partners ensures that course content reflects current industry standards while remaining accessible to those new to statistical programming.
Self-directed learners can build forecasting skills through a structured progression: starting with R fundamentals and basic statistics, advancing to time series concepts using packages like forecast and tsibble, then applying these tools to solar-specific datasets. Online repositories of historical PV generation and meteorological data provide practice material, while open-source case studies demonstrate how professionals structure forecasting workflows for different grid applications.
Career opportunities for R forecasting specialists span multiple sectors. Grid operators seek analysts who can interpret forecast outputs and integrate them into dispatch decisions. Energy trading firms value professionals who understand both the statistical models and the market mechanics that forecasts inform. Research institutions and consulting firms need experts who can customize forecasting approaches for specific PV installations or regional conditions. As solar penetration increases, demand for these specialized skills continues to grow across the renewable energy sector.
Common Questions About R Forecasting for PV Systems
Professionals implementing R-based forecasting systems typically encounter similar challenges and questions during deployment. Understanding these common concerns helps teams plan realistic implementations and set appropriate expectations.
Which R package should beginners start with for PV forecasting?
The forecast package provides the most accessible entry point, with straightforward functions for time series analysis and extensive documentation. Once comfortable with basic concepts, practitioners can progress to fable for modern tidy-data workflows or caret for machine learning approaches.
What forecast accuracy can be realistically expected?
Day-ahead forecasts typically achieve 10-20% normalized mean absolute error for hourly predictions, with performance varying by location, weather variability, and forecast horizon. Accuracy degrades significantly beyond 48 hours, and cloudy climates present greater challenges than arid regions with stable irradiance patterns.
How often should forecasting models be retrained?
Most operational systems retrain models weekly or monthly to capture seasonal shifts and equipment degradation, while also performing daily updates with the most recent data. Systems experiencing rapid changes (new panel soiling patterns, nearby construction affecting shading) benefit from more frequent retraining cycles.
What computational resources are necessary for running R forecasting packages?
Small-scale systems (under 10 MW) run effectively on standard desktop computers with 8GB RAM, while utility-scale portfolios benefit from dedicated servers with 32GB+ RAM and multiple cores for parallel processing. Cloud-based solutions offer scalable alternatives without upfront hardware investment.
How do open-source R forecasts compare to commercial forecasting solutions?
R-based systems often match or exceed commercial platforms in accuracy when properly configured and maintained, though they require more in-house technical expertise. Commercial solutions provide integrated support, automated updates, and user-friendly interfaces, while R offers complete customization and zero licensing costs.
Integration challenges frequently center on data pipeline reliability rather than forecasting algorithms themselves. Organizations struggle more with consistent weather data feeds, real-time system monitoring, and API connections to grid management platforms than with R package capabilities. Establishing robust data infrastructure before deploying sophisticated forecasting models prevents frustration and ensures models receive the quality inputs they need.
Learning resources have expanded significantly as PV forecasting adoption grows. University partnerships offer structured coursework combining statistical theory with practical R implementation, while online communities provide peer support and code examples. Mose Solar’s educational programs include hands-on training with real PV datasets, bridging the gap between academic concepts and operational deployment. Professionals benefit most from project-based learning that requires solving actual forecasting problems rather than abstract exercises.
R forecasting packages have established themselves as indispensable tools for solar PV grid integration, offering a powerful combination of statistical rigor, operational flexibility, and cost accessibility that few commercial platforms can match. Their open-source nature removes financial barriers for aspiring photovoltaic professionals while providing the same analytical capabilities used by major grid operators and energy traders worldwide.
The proven effectiveness of these packages in real-world applications, from day-ahead market bidding to real-time grid stability management, demonstrates that sophisticated forecasting technology is no longer the exclusive domain of large utilities with extensive budgets. University researchers, independent system operators, and renewable energy startups all leverage the same forecast, fable, and machine learning packages to optimize PV integration and maximize economic returns.
For professionals entering the solar industry, proficiency in R-based forecasting represents a valuable skill set that directly addresses one of the sector’s most pressing challenges: managing variability while maintaining grid reliability. The statistical foundation these packages provide translates across different solar technologies, geographic regions, and market structures.
Mose Solar remains committed to advancing photovoltaic education through university collaborations and professional development programs that equip the next generation of solar professionals with practical forecasting skills. As grid operators worldwide increase their reliance on solar power, the ability to generate accurate, actionable PV forecasts will continue separating competent practitioners from true industry leaders. R forecasting packages provide the technical foundation for that expertise.