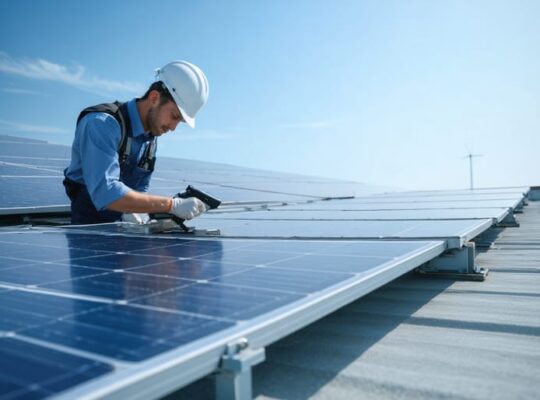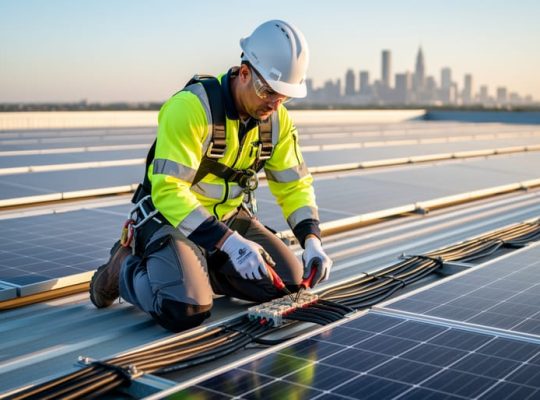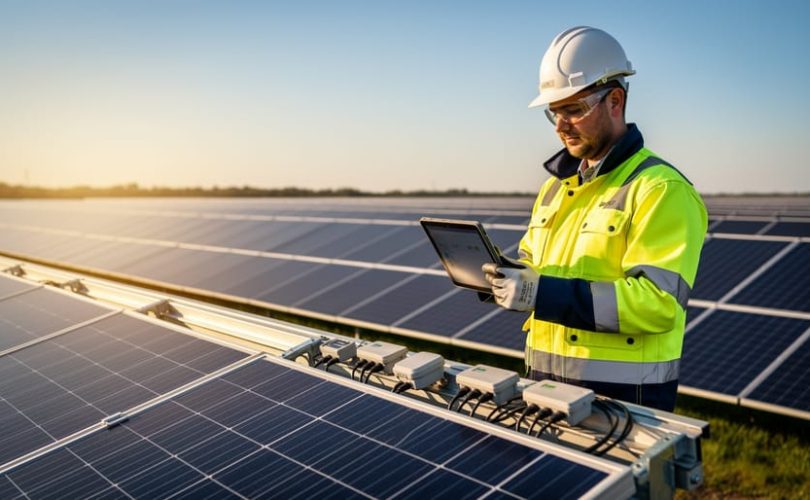
Becoming an M&V professional means mastering the systematic process of measuring, verifying, and documenting photovoltaic system performance to ensure predicted energy production aligns with actual output. This specialized skill set combines data acquisition, statistical analysis, and standardized reporting protocols to quantify system efficiency, validate performance guarantees, and identify operational issues before they escalate into significant losses.
The professional application of Measurement and Verification in solar O&M has evolved from optional best practice to essential competency. As the global PV fleet ages and performance-based contracts become standard, asset owners and operators demand verifiable proof that systems deliver expected returns. Independent studies consistently show that facilities with structured M&V programs detect underperformance 40-60% faster than those relying on passive monitoring alone, translating directly to reduced revenue losses and extended asset lifespans.
The methodology itself follows internationally recognized frameworks, primarily the International Performance Measurement and Verification Protocol adapted for renewable energy applications. The core workflow integrates equipment-level monitoring, meteorological data correlation, performance modeling, and deviation analysis into a continuous feedback loop. This systematic approach separates normal operational variance from actionable deficiencies, enabling maintenance teams to prioritize interventions based on financial impact rather than intuition.
For professionals entering or advancing within the PV industry, M&V proficiency represents a distinct career differentiator. The technical rigor required to implement these protocols properly demands both practical field experience and formal training in measurement science, data analysis, and reporting standards. Understanding where this skill fits within the broader O&M certification landscape helps aspiring technicians and engineers chart a clear path from foundational competencies to specialized expertise.
Understanding M&V Professional Standards for PV Systems
The IPMVP framework provides the technical foundation for all professional M&V work in PV systems. Developed by the Efficiency Valuation Organization, this protocol outlines systematic methods to measure and verify energy performance with documented accuracy. For solar installations, IPMVP establishes how M&V professionals quantify actual production against predicted output, using calibrated measurement and statistical analysis rather than estimation.
IPMVP defines four measurement options that apply differently to PV operations. Option A uses key parameter measurement with stipulated values, tracking specific variables like irradiance while accepting engineering estimates for others. Option B requires measurement of all performance parameters affecting energy production, making it the most comprehensive approach for PV systems. Option C measures energy generation at the system boundary using production meters, ideal for whole-system performance validation. Option D employs calibrated simulation models, useful when direct measurement isn’t feasible or cost-effective.
M&V professionals validate that installed systems meet their design specifications and contractual performance guarantees. This involves comparing measured energy yield against design predictions, normalized for actual weather conditions. When a 500 kW system underperforms its guaranteed capacity factor, M&V documentation identifies whether the shortfall stems from equipment defects, design errors, or acceptable weather variations.
The protocol requires uncertainty analysis for every measurement. You calculate and report the confidence interval of your findings, typically targeting ±10% accuracy for energy measurements. This uncertainty quantification separates professional M&V from casual performance monitoring.
Contractual applications demand strict adherence to IPMVP standards. Performance guarantees in power purchase agreements reference specific measurement methodologies, sensor accuracies, and acceptance criteria. Your M&V implementation must match these contractual requirements exactly, or disputes arise over whether the system truly meets its obligations. This is where M&V training becomes essential, misapplied protocols can invalidate years of performance data when stakeholders challenge your methodology.
Essential Tools and Equipment for M&V in PV Operations
Professional M&V implementation demands precision instrumentation and robust data systems. The measurement equipment you select directly affects data quality, uncertainty calculations, and stakeholder confidence in your verification results.
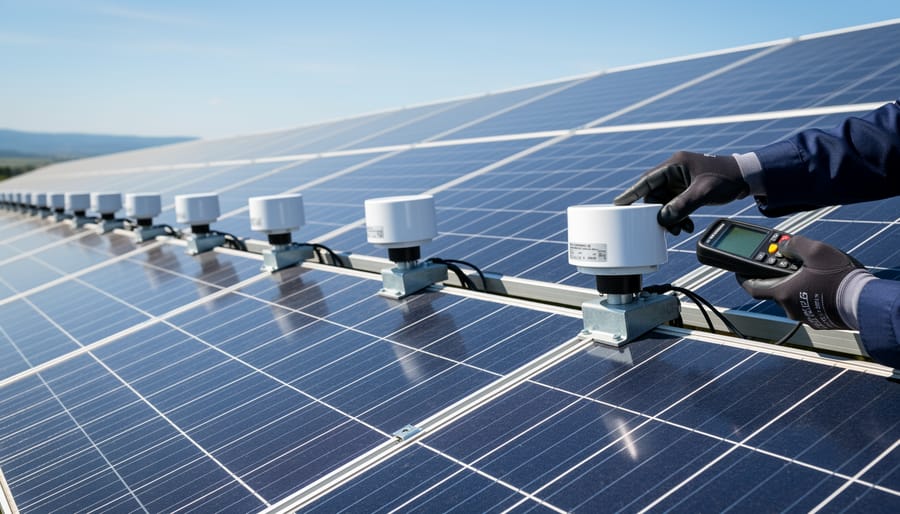
Start with irradiance measurement as your foundation. Pyranometers measure global horizontal irradiance (GHI), plane-of-array irradiance (POA), and diffuse irradiance depending on configuration. Class A or secondary standard pyranometers provide the accuracy M&V professionals need, with typical uncertainty below 3%. Mount reference cells adjacent to PV modules for direct comparison, though these measure only the spectral response of the specific cell technology rather than full-spectrum irradiance.
Electrical measurement instruments form the core of performance verification. Current and voltage sensors must match your system scale, rogowski coils or hall effect sensors for inverter-level monitoring, precision shunts for string-level analysis. IV curve tracers let you diagnose module-level issues by comparing characteristic curves against manufacturer specifications. Capacitive discharge tracers work for systems up to 1500V, while most commercial units handle 1000V maximum.
Thermal imaging cameras identify hotspots, bypass diode failures, and connection problems invisible to electrical measurements alone. Resolution matters here, 320×240 pixels represents the minimum for meaningful PV diagnostics, with 640×480 preferred for large arrays. Temperature measurement accuracy of ±2°C or better ensures reliable identification of thermal anomalies.
Your data infrastructure determines whether you can actually implement systematic M&V protocols. Data acquisition systems (DAS) must log measurements at appropriate intervals, one-minute data for performance analysis, fifteen-minute or hourly for energy verification. The system needs sufficient channel capacity for all measurement points, expandability for adding sensors, and reliable data storage with redundancy.
- Measurement equipment: Pyranometers (Class A/secondary standard), reference cells, anemometers, ambient temperature sensors, back-of-module temperature sensors
- Electrical diagnostic tools: IV curve tracers, multimeters (true RMS), clamp meters, insulation resistance testers, power quality analyzers
- Imaging and inspection: Thermal cameras (≥320×240 resolution), visual inspection equipment, electroluminescence testing systems
- Data systems: Data loggers with sufficient channels, SCADA integration platforms, cellular or ethernet connectivity, battery backup for continuous operation
- Software platforms: M&V analysis software (PVsyst, PVSOL, or similar), statistical analysis tools, report generation systems, database management for historical data
- Documentation systems: Digital asset management for equipment records, maintenance logs, calibration certificates, and as-built drawings
Software selection deserves careful consideration. Your analytical platform must normalize performance for weather conditions, calculate uncertainty, and generate reports meeting IPMVP requirements. Industry-standard tools like PVsyst or PVSOL provide weather correction algorithms and expected performance calculations. Pair these with database systems that store historical data for trend analysis and degradation studies.
Calibration certificates and traceability matter for professional M&V work. Pyranometers require annual recalibration against NIST-traceable standards. Electrical measurement equipment needs verification every one to two years depending on usage. Maintain calibration records as part of your quality assurance documentation, auditors and stakeholders will request them.
Safety Protocols and Pre-Implementation Considerations
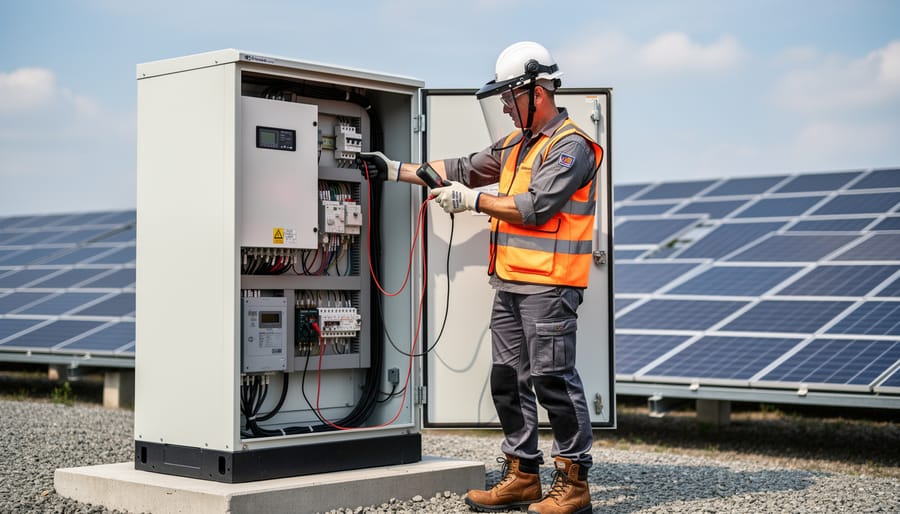
Before conducting any M&V activities on PV systems, you must establish comprehensive safety protocols. Working with energized photovoltaic arrays presents serious electrical hazards, including shock, arc flash, and burns. Never begin measurement activities without first verifying that all personnel have current electrical safety training and understand the specific risks of DC power systems, which behave differently from AC installations and can sustain dangerous arcs even at relatively low voltages.
Your pre-implementation safety assessment should identify all potential electrical hazards at the site. Document the system’s maximum operating voltage, short-circuit current ratings, and arc flash boundary calculations. Establish proper lockout/tagout procedures for any equipment that must be de-energized during specific measurement tasks. While many M&V activities like irradiance monitoring or thermal imaging can occur without direct electrical contact, tasks involving IV curve tracing or invasive electrical measurements require strict isolation protocols and hot work permits.
Personal protective equipment requirements vary by task. At minimum, wear arc-rated clothing, safety glasses, and insulated gloves rated for the system voltage when working within the arc flash boundary. Thermal imaging and visual inspections from outside electrical enclosures require less intensive PPE but never compromise on eye protection. Deploy barricades and warning signage to prevent unauthorized personnel from entering work areas during measurement activities.
Halt all M&V work immediately if weather conditions deteriorate, equipment shows signs of damage or abnormal operation, or if you encounter unexpected electrical readings during measurement. Lightning, high winds, or wet conditions make electrical work exponentially more dangerous. When analyzing collected data using tools like R performance analysis software, conduct this work in a safe office environment rather than in the field near energized equipment whenever possible.
Step-by-Step M&V Implementation Process
Establish Baseline Performance Parameters
Establishing accurate baseline performance parameters begins with comprehensive documentation of the PV system’s design intent and theoretical capabilities. Start by collecting all nameplate data from individual modules, inverters, and other major equipment, record manufacturer specifications, rated power outputs (Wp), voltage and current ratings at standard test conditions (STC: 1000 W/m², 25°C cell temperature, AM 1.5 spectrum), and temperature coefficients that quantify performance degradation at elevated temperatures.
Next, obtain the complete commissioning report generated when the system was first energized. This critical document establishes initial operating conditions, includes acceptance test results, and provides the first verified performance measurements against which future data will be compared. The commissioning report should contain initial performance ratio calculations, string current measurements, and infrared scan results that confirm no manufacturing defects or installation errors are affecting baseline performance.
Gather the original energy production model used during system design, typically generated by software like PVsyst, SAM, or Helioscope. This model contains design irradiance assumptions (based on historical weather data for your location), expected array losses from shading, soiling, wiring resistance, and inverter efficiency curves. The model’s predicted annual energy production becomes your theoretical benchmark for M&V analysis.
Document environmental assumptions including average operating temperature ranges, expected soiling rates, and any performance guarantees specified in contracts that may involve solar regulations or utility agreements. Store all baseline documentation in a centralized repository accessible to the M&V team, creating a reference library that supports all future performance verification activities.
Deploy Monitoring and Measurement Systems
Installing measurement equipment begins with determining optimal sensor locations based on system architecture and verification objectives. Mount irradiance sensors on the same plane as PV modules, ensuring unobstructed sky view and minimal shading. Position sensors to represent different array orientations if your system has multiple tilts or azimuths. Secure module temperature sensors to the back surface of representative modules using thermal adhesive, avoid locations near junction boxes or frame edges where readings may not reflect typical operating conditions.
Configure data loggers to record at 5-minute or 15-minute intervals for granular performance analysis. Shorter intervals capture transient events and ramp rates, while longer intervals reduce data storage requirements. Set logger time stamps to UTC or local standard time consistently across all devices to prevent confusion during analysis. Establish communication pathways through cellular modems, ethernet connections, or radio links depending on site infrastructure and data access requirements.
SCADA integration requires mapping measurement points to visualization platforms using standard protocols like Modbus TCP or DNP3. Define measurement boundaries clearly in your documentation, specify which inverters, combiners, or array sections each sensor represents. This boundary definition becomes critical when isolating underperforming areas during later analysis.
Calibrate all sensors before deployment using traceable reference standards. Document calibration certificates and schedule recalibration annually or per manufacturer specifications. Revenue-grade meters require more frequent verification than diagnostic sensors. Maintain calibration records as part of your M&V documentation package to demonstrate measurement credibility during third-party reviews.
Collect and Validate Performance Data
Systematic data collection forms the foundation of reliable M&V analysis. Pull energy production readings directly from the inverter’s data logging system at 15-minute intervals, this granularity captures transient cloud events and system behavior throughout the day. Record DC voltage and current from each string or combiner box simultaneously to identify underperforming arrays before they impact overall output.
Your irradiance sensors must align with the module plane of array. Cross-reference pyranometer readings with satellite data from services like SolarGIS or NREL to catch sensor drift early. Temperature measurements need two points: ambient air temperature at module height and back-of-module surface temperature using calibrated thermocouples or infrared sensors.
Run automated data quality checks every 24 hours. Flag any values outside physical limits, negative power readings, irradiance exceeding 1400 W/m², or module temperatures differing from ambient by more than 40°C in standard conditions. Look for flatlined readings lasting more than one measurement interval, which signal sensor failures or communication losses.
Handle missing data transparently. If gaps span less than one hour and weather was stable, linear interpolation works. Longer gaps require weather-normalized modeling based on adjacent days with similar irradiance profiles. Document every interpolation method in your M&V report, stakeholders need to understand which data points are measured versus estimated.
Compare daily performance ratios against a 30-day rolling average. Deviations exceeding two standard deviations warrant immediate investigation for soiling, shading, equipment degradation, or measurement errors.
Analyze Performance Against Expected Values
Calculate the performance ratio (PR) by dividing actual energy output by the expected output under measured irradiance and temperature conditions. A well-performing PV system typically achieves a PR between 75% and 85%, accounting for all system losses. Compare this against your baseline specifications and manufacturer guarantees.
Normalize actual production data to standard test conditions (1000 W/m² irradiance, 25°C cell temperature) using correction factors. This removes weather variability and isolates true performance changes. Calculate the temperature coefficient adjustment: for every degree above 25°C, crystalline silicon modules typically lose 0.4-0.5% efficiency.
Use statistical process control charts to identify significant deviations. A single day 10% below expected might be weather-related, but three consecutive weeks trending 5% low signals a real problem requiring investigation. Apply the t-test to determine if performance differences are statistically significant or within normal variation.
Calculate your uncertainty bounds, typically ±3-5% for field measurements, to avoid chasing phantom issues. When actual performance falls outside the prediction band minus uncertainty, document the deviation magnitude, duration, and potential causes. Flag degradation rates exceeding 0.5% annually or sudden drops exceeding 2% as priorities for root cause analysis.
Document Findings and Generate M&V Reports
Creating comprehensive M&V reports transforms raw performance data into actionable intelligence for stakeholders. Your documentation must clearly communicate methodology, findings, and their implications while adhering to IPMVP reporting standards.
Structure your M&V report with five core components: executive summary stating key performance metrics and deviations, methodology section detailing measurement approach and equipment used, results presentation with visual data representations, uncertainty analysis quantifying measurement confidence intervals, and recommendations for system optimization or corrective actions.
Present performance data using standardized metrics that stakeholders understand. Report the performance ratio, specific yield (kWh/kWp), availability percentage, and actual versus expected energy production. Include weather-normalized comparisons to isolate system performance from environmental variations. Use graphs showing monthly trends, scatter plots correlating irradiance to output, and heat maps identifying temporal performance patterns.
Quantify uncertainty in your measurements by stating instrument accuracy specifications, data completeness percentages, and confidence intervals for reported values. IPMVP requires transparent uncertainty analysis, state whether deviations fall within acceptable measurement error or indicate genuine performance issues.
Establish reporting frequency based on contract requirements and system size. Monthly reports suit most commercial installations, while quarterly summaries work for smaller systems. Critical underperformance triggers immediate notification regardless of scheduled reporting cycles.
Tailor communication style to your audience: technical details for O&M teams, financial impact summaries for asset owners, and compliance confirmation for regulatory bodies.
Verification Methods and Performance Validation
Confirming the accuracy of your M&V implementation requires systematic validation against multiple reference points. Professional M&V practices aren’t complete until you verify that your measurements align with independent data sources and fall within statistically acceptable ranges.
Start with uncertainty analysis for each measurement point. Calculate instrument uncertainty (typically 0.5-2% for quality sensors), data acquisition uncertainty, and sampling uncertainty based on measurement intervals. Combine these using root-sum-square methodology to determine total measurement uncertainty, which should remain below 5% for annual energy calculations.
Cross-verification provides practical validation without additional equipment investment. Compare your pyranometer readings against nearby weather stations or satellite irradiance databases. Your site measurements should align within 3-5% of regional data after adjusting for microclimate differences. Match your production data against the inverter’s internal meters and utility revenue meters, discrepancies exceeding 1% warrant investigation.
Validation becomes more rigorous when you implement these checkpoints:
- Performance ratio calculations fall between 75-85% for well-maintained systems
- Temperature-corrected output matches manufacturer specifications within ±3%
- Monthly energy production aligns with PVsyst or equivalent models within ±8%
- Soiling losses don’t exceed regional baseline data by more than 15%
- Degradation rates remain between 0.3-0.8% annually for modern modules
Third-party validation adds credibility for warranty claims or performance guarantees. Independent engineers review your methodology, inspect sensor placement, audit data quality, and recalculate key metrics. This verification confirms your M&V implementation meets IPMVP Option A or B requirements and provides defensible documentation for contractual disputes.
Run parallel measurements periodically. Deploy temporary reference sensors alongside your permanent monitoring equipment to verify sensor drift hasn’t compromised accuracy. Replace or recalibrate any instrument showing drift exceeding manufacturer specifications.
Integrating M&V into Certification Training Programs
Formal M&V training transforms theoretical knowledge into practical competency through structured certification programs. Mose Solar’s PV maintenance certification curriculum integrates M&V protocols as a core component, preparing professionals to implement these practices from day one in the field.
The training program structures M&V education across three integrated modules. First, participants master IPMVP fundamentals and learn to interpret performance specifications. Second, hands-on lab exercises provide direct experience with measurement equipment, calibrating pyranometers, operating IV curve tracers, and configuring data loggers on live PV arrays. Third, students complete real-world case studies analyzing actual system performance data to generate professional M&V reports.
University partnerships enhance this framework by providing access to research-grade facilities and experienced instructors who bridge academic rigor with industry requirements. Students work with operational solar installations maintained by partner institutions, collecting authentic performance data under various weather conditions and system configurations.
Competency requirements for certification include demonstrating proficiency in baseline establishment, data validation techniques, uncertainty analysis, and report generation that meets professional standards. Participants must complete measurement exercises within specified tolerance ranges and produce documentation suitable for stakeholder review. This practical assessment ensures graduates can implement M&V protocols independently, meeting the technical demands employers expect from certified O&M professionals.
Common M&V Challenges and Troubleshooting Solutions
M&V professionals frequently encounter sensor drift, where pyranometers and reference cells gradually lose calibration accuracy, typically shifting 2-3% annually without proper maintenance. Recalibrate irradiance sensors every 12-18 months and establish cross-checking protocols using multiple measurement points to identify drift patterns early. When one sensor shows diverging trends compared to neighboring stations, investigate immediately rather than waiting for scheduled calibration.
Data gaps create verification headaches, particularly when monitoring systems experience communication failures during peak production periods. Implement redundant data logging with both on-site and cloud-based storage, and use regression models to estimate missing intervals based on nearby reference sites. Never simply interpolate missing data, document gaps transparently in M&V reports and calculate the uncertainty impact on annual energy estimates.
Quantifying soiling losses separately from other performance issues requires installing cleaned reference sensors alongside naturally soiled production arrays. Without this comparison baseline, you’ll conflate soiling with degradation, shading changes, or inverter underperformance. Conduct periodic manual cleaning tests on sample modules, measuring before-and-after output to validate soiling impact assumptions.
Distinguishing actual degradation from temporary performance drops demands multi-year data analysis using performance ratio trends normalized for weather variations. Seasonal patterns, evolving shading, and vegetation growth can mimic degradation if you’re comparing only year-over-year snapshots. Skills developed through energy auditor certification programs help diagnose these overlapping issues systematically.
Non-standard conditions, partial cloud cover, snow reflection, equipment testing during commissioning, require custom normalization methods beyond standard performance models. Filter outlier data points that don’t represent typical operating conditions, but preserve them in raw datasets with flagged annotations explaining the deviation source.
Next Steps for M&V Professional Development
Advancing your M&V expertise requires structured learning and hands-on application. Enrolling in online PV courses through Mose Solar’s certification program provides comprehensive training in IPMVP protocols, data analysis techniques, and reporting standards specific to photovoltaic systems. These programs are developed in collaboration with university partners to ensure curriculum reflects both academic rigor and industry requirements.
Beyond initial certification, stay current with evolving standards by joining professional organizations that publish M&V guideline updates. Attend industry conferences where practitioners share case studies on emerging monitoring technologies and refined verification methodologies. Subscribe to IPMVP bulletins and participate in webinars covering new measurement instruments or software capabilities.
Apply your developing skills through progressive O&M responsibilities. Start with routine performance monitoring tasks, then graduate to baseline establishment projects and full M&V plan development. Seek mentorship from experienced M&V professionals who can review your reports and provide feedback on analysis techniques.
Consider specializing in specific M&V applications such as utility-scale verification, residential portfolio analysis, or degradation studies. Each concentration requires distinct expertise in measurement approaches and stakeholder reporting. Document your project work to build a portfolio demonstrating competency across various system types and M&V protocols, strengthening your qualifications for advanced O&M positions.
Frequently Asked Questions About M&V in PV Operations
What certifications are needed for M&V professionals?
While no single universal M&V certification exists, PV professionals typically pursue Operations and Maintenance Certification Training that includes M&V methodologies as a core component. Many programs incorporate IPMVP standards training, and additional credentials in energy auditing or performance engineering strengthen professional qualifications.
How often should M&V be conducted on PV systems?
Continuous monitoring provides ongoing data, but formal M&V reporting typically occurs quarterly for operational systems and annually for performance guarantee verification. High-value installations or those under warranty may require monthly analysis, while baseline M&V happens immediately after commissioning and again after any major system modifications.
What’s the return on investment for professional M&V implementation?
Professional M&V typically identifies 5-15% performance improvements through early detection of degradation, soiling impacts, and operational issues. For commercial and utility-scale installations, the cost of M&V services usually represents less than 2% of annual O&M budgets while protecting performance guarantees that can be worth millions in energy revenue.
How does professional M&V differ from basic system monitoring?
Basic monitoring tracks real-time production and alerts for outages. Professional M&V goes further by normalizing data for weather variations, calculating statistical confidence intervals, comparing actual performance against design expectations using IPMVP protocols, and producing documentation that satisfies contractual and financial reporting requirements.
The distinction matters because asset owners and investors rely on M&V professionals to verify that systems deliver promised returns, not just to confirm they’re operating. Your monitoring system might show everything running, but M&V analysis reveals whether performance matches projections after accounting for actual irradiance, temperature effects, and system degradation. This level of rigor protects both the technical and financial integrity of PV investments.
Certification training programs prepare you to handle these requirements by combining theoretical M&V knowledge with hands-on application using real system data and industry-standard tools. You’ll learn not just how to collect measurements, but how to interpret results, calculate uncertainty, and communicate findings to stakeholders who make operational and financial decisions based on your analysis.